2.15.0 New User Experience for Disaster Recovery for Dell
About this release
Cyberstorage for Dell 2.15.0 introduces a redesigned interface for Disaster Recovery. The legacy Eyeglass-style UI — individual floating application windows such as DR Assistant, DR Dashboard, Reports On Demand, Unlock My Files!, and Data Config Migration — has been replaced by a single, consolidated left-hand navigation shared across all Cyberstorage for Dell products, with Disaster Recovery organized into five sidebar items: Readiness, Failover, Reports, Unlock My Files, and Data Migration. A Switch to Legacy UI link remains available at the bottom of the sidebar for administrators who still need the previous interface during the transition period.
This page is the starting point for learning the 2.15.0 interface for Disaster Recovery: the new navigation structure, what each redesigned page looks like, where familiar legacy tasks moved, and the terminology changes to be aware of.
Navigation overview
The left sidebar is organized into a shared, portal-wide top section and per-product sections below it:
| Sidebar section | Contents |
|---|---|
| Shared (top of sidebar) | Alarms, Jobs, Inventory, Health Check |
| Data Security | Threat Detections (with a Detection Controls sub-item), Data Auditing, Integrations |
| Disaster Recovery | Readiness, Failover, Reports, Unlock My Files, Data Migration |
| Cyber Vault | AirGap |
This matches the sidebar structure described on Data Security's 2.15.0 New User Experience. Unlock My Files is located under Disaster Recovery, not Data Security.
A gear icon and a help (?) icon appear in the top-right corner of every page for account/system settings and contextual help, respectively.
Inventory (shared, top of sidebar) is the central view of everything managed by Superna, with three tabs: Manage Devices, License Management, and Backup.
Inventory reflects the last completed inventory collection, not live state — after adding a cluster or making a change, allow 5–10 minutes for the automatic inventory task to run. The page does not auto-refresh; reopen it or use its refresh control to see the latest collection.
Manage Devices is arranged as a hierarchy:
- The core appliance at the top, showing its Operating System, Version, and Status.
- Any Extended Cluster Appliance (ECA) nodes below it, in an expandable section with a Last Check-In timestamp, a View Managed Services button, and its own ECA Node/IP Address/Operating System/Version/Status table.
- The managed storage systems and other devices protected or managed by Superna below that, under a header showing the Effective Version across all managed devices.
Each device row shows the device name and platform, a health indicator showing whether Superna is currently connected to it, and icons for which Superna capabilities are licensed for that device. Expanding a device row shows its Licenses, ID, IP Address, and Version; its row menu offers Launch OneFS, Edit, and Remove.
License Management shows a capacity card per licensed product (Data Security, Disaster Recovery, AirGap) and a table grouped by product with Product, Provider, Type, Platform, Entitlement, Product Expiry, and Support Expiry columns. Product is the Superna product the license was issued for; Platform is the storage platform it applies to (PowerScale or ECS/ObjectScale).
Backup lists backup archives (Archive Name, Type, Date Created, Size) with a Create Backup dialog offering two backup types — Full Backup (configuration, policies, and job history) and Support Bundle (lightweight diagnostics with logs and config) — plus an Include cluster reports toggle, alongside a Send to Support action for selected archives.
Health Check (shared, top of sidebar) is where scheduled self-tests and diagnostic tools live, with five tabs:
- Overview — a summary card per tool: Security Guard and Robo Audit (pass rate over the last 10 runs, last-run timestamp, schedule, and a Run Now button) and Runbook Robot (run count or a "no runs" state — a Disaster Recovery feature) — plus a Runs calendar heatmap and per-tool run/pass/fail counters for the year.
- Runs — a master-detail view like Jobs: a filterable list of individual health-check executions on the left (Status, Job Type, and Date filters, plus search) with a Job Tree/Errors panel on the right and Download/Copy actions.
- Manage Services — one row per ECA node plus Eyeglass itself, in a Virtual Machine/IP:Port/Eyeglass Token/Service Type table with a Last check-in timestamp; toggle between the ECA Health Check and ECA Monitor views above the table (ECA Monitor opens a Grafana dashboard of event rate per ECA).
- Log Parser — manages uploaded backup files used to generate Log Parser reports (Customer/Appliance ID/Upload Date/Status table, search, bulk Delete, and an Add Backup button — backups themselves are generated from Inventory).
- Settings — lets you configure each tool individually: an enable/disable toggle and Run Now button per tool, plus tool-specific configuration such as Security Guard's Active Directory user credentials, target managed device, and run interval.
Readiness
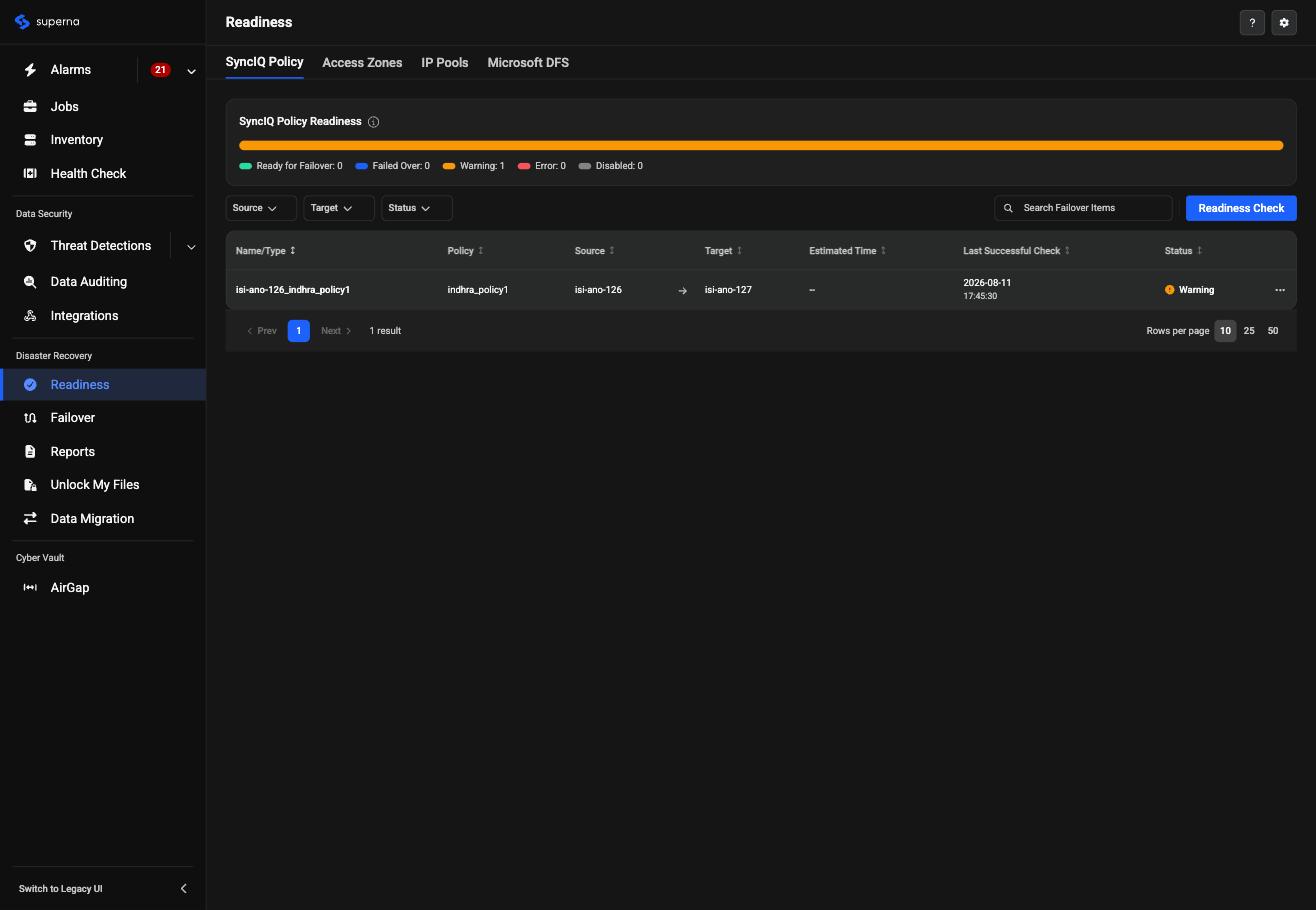
Readiness (first item, left sidebar under Disaster Recovery) replaces the legacy DR Dashboard's four readiness tabs — Zone Readiness, Pool Readiness, DFS Readiness, and Policy Readiness — consolidating them into one page with four renamed tabs: SyncIQ Policy, Access Zones, IP Pools, and Microsoft DFS.
Each tab (for example, SyncIQ Policy Readiness) has its own summary bar — a proportional colored bar plus a count for each state: Ready for Failover, Failed Over, Warning, Error, and Disabled — giving an instant view of that tab's DR health before drilling into individual rows.
Each tab shows the same core columns as its legacy counterpart — Name/Type, source and target cluster, estimated failover time, last successful readiness check, and a status badge (Ready for Failover, Failed Over, Warning, Error, or Disabled) — plus Source, Target, and Status filters and a search field. A Readiness Check button in the header triggers an on-demand check, replacing the legacy Run Readiness button.
Selecting a row opens a slide-out with its Errors and Warnings, each surfaced as a specific named condition to resolve (for example, "Domain Mark Validation" or "Corrupt Failover Snapshots") rather than a bare pass/fail. A Details button opens a full Topology & Mapping page for that item: a visual diagram of the source and target clusters with the current transfer status, and Errors & Warnings, Shares, and Exports tabs so the recovery scope can be verified before execution.
Drag the slider below to compare the legacy DR Dashboard's Zone Readiness tab with the redesigned Readiness page:

Drag the handle to compare — or use the arrow keys when focused.
The legacy Continuous Op Dashboard icon and the LiveOps DR Testing tab (present on both the legacy DR Assistant and DR Dashboard windows) do not have a distinct sub-tab on the new Readiness page — none of the four Readiness tabs include LiveOps/Continuous-Ops-specific content (cluster reachability, detected OneFS version, or the per-policy Continuous Ops Status described in LiveOps Continuous Operations Dashboard). The closest equivalent for cluster reachability and version is the platform-level Inventory page. See the caveat in "Where things moved" below.
Failover
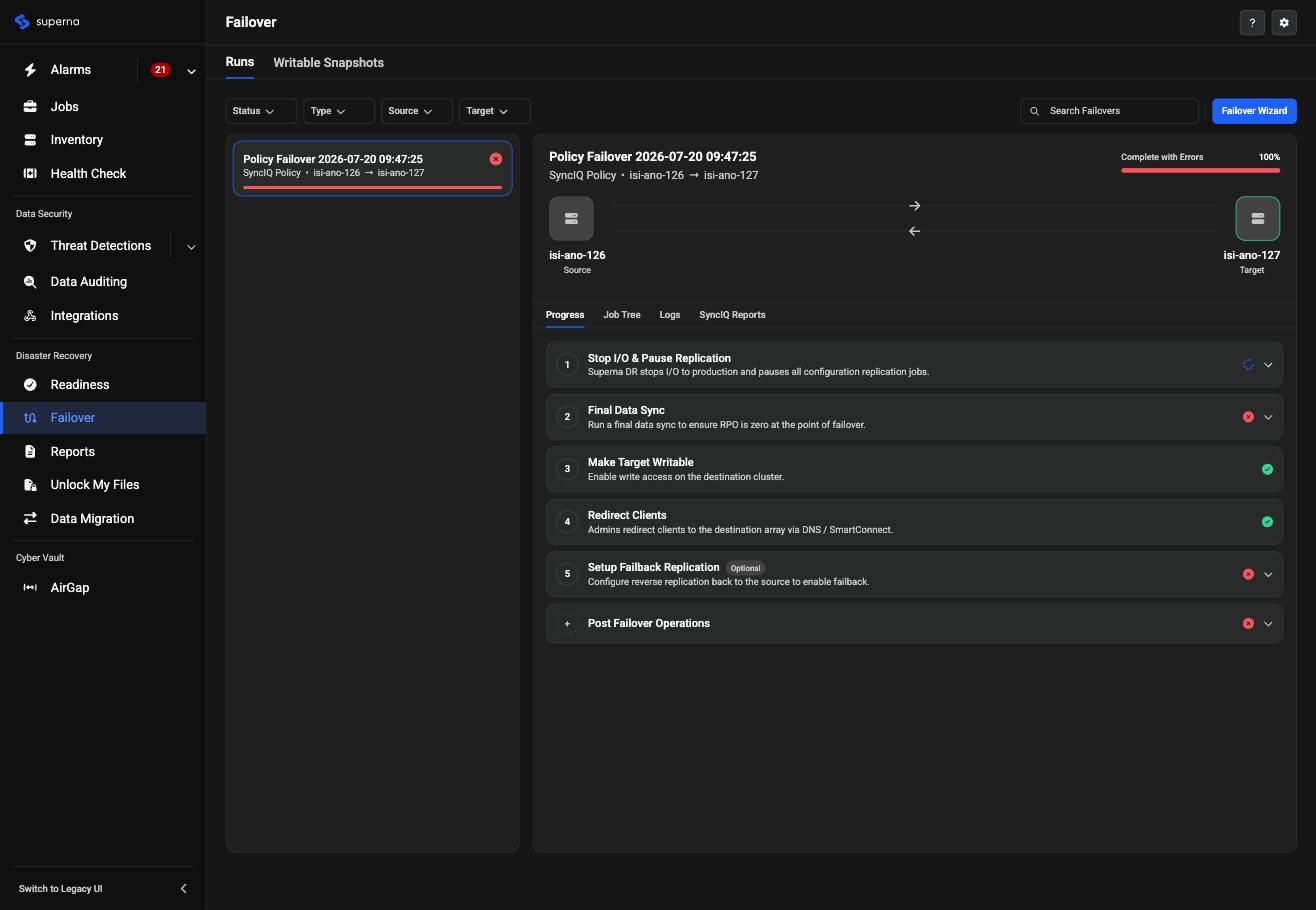
Failover (second item) replaces the legacy DR Assistant window's Failover Wizard, Running Failovers, and Failover History views, consolidating job execution and history into a Runs tab, alongside a separate Writable Snapshots tab carried over from the legacy Writable Snapshots view.
Runs tab
The Runs tab lists each failover job with its policy pair, source and target cluster, and overall progress. Selecting a job opens Progress, Job Tree, Logs, and SyncIQ Reports tabs, showing the failover's step-by-step sequence, each with a pass/fail indicator:
- Stop I/O & Pause Replication
- Final Data Sync
- Make Target Writable
- Redirect Clients
- Setup Failback Replication (optional)
A sixth group, Post Failover Operations, sits below these five with its own status marker, independently pass or fail: skip configuration replication, policy failover, post failover inventory, transfer pool mapping, policy validation, and fetch reports. A failover can show all five steps above passing while still showing a failure in this group, so check it even when the main sequence is green.
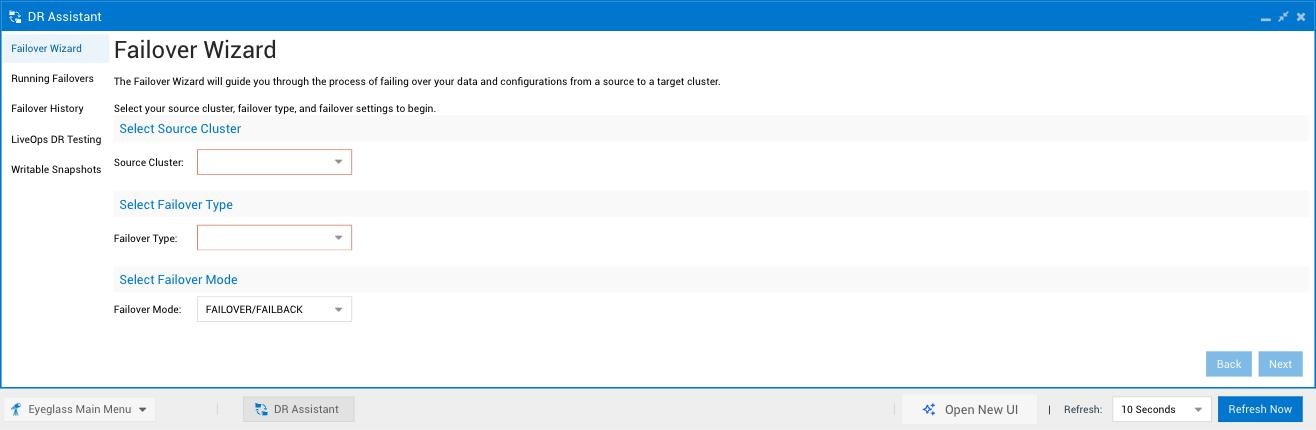
Status, Type, Source, and Target filters and a search field narrow the list. A Failover Wizard button in the header replaces the legacy Failover Wizard menu item and launches the same guided source-cluster / failover-type / failover-mode flow.
Writable Snapshots tab
The Writable Snapshots tab lists each writable snapshot with its path, source path, device (cluster), and creation time, plus Delete and Create Writable Snapshot controls. See Writable-Snapshots (v2) for what a writable snapshot is, when to use one, and the REST API this tab maps onto.
Failover Wizard steps
- Superna Failover Support — links out to the Failover Release Notes, Best Practices, and Formal Support Policy, and requires confirming they've been read before continuing.
- Source, mode & type — combines source cluster selection (with its readiness status shown inline), failover mode, and failover type on one screen:
- Planned Failover — "manages live transfers of critical systems and data between primary and DR sites, ensuring data consistency and smooth transitions."
- Emergency Failover — "switches operations to the DR site during an unexpected disaster at the primary site, prioritizing rapid recovery to minimize downtime."
- This is the same underlying decision described as controlled vs. uncontrolled failover in Controlled vs. Uncontrolled Failover.
- Failover type: SyncIQ Policies, Access Zones, IP Pools, or DFS Policies.
- Configure Failover Settings — a further operation mode choice, plus the same per-type options as the legacy wizard:
- Operation mode: Failover/Failback, Enable Rehearsal (test failover with isolated copies at the DR site, without impacting production), or Revert Rehearsal (cleans the DR environment post-rehearsal, removing test systems/data).
- Per-type options: Data Sync, Quota Sync, SyncIQ Resync Prep, Block Failover on Warnings, Disable SyncIQ Jobs on Failover Target.
- Select Items to Failover — displays the recovery objects available for the selected scope, for confirmation.
- Preflight validation — re-verifies readiness. When SMB Data Integrity is enabled (for failover types with SMB shares), this step also identifies any open files or active processes that may impact the failover, so they can be reviewed before proceeding.
- Review and Confirm — a summary of the complete configuration (source, failover mode, selected options, and recovery objects), followed by a single confirmation to start the job.
Drag the slider below to compare the legacy DR Assistant's Failover Wizard screen with the redesigned Failover page:
Drag the handle to compare — or use the arrow keys when focused.
Reports
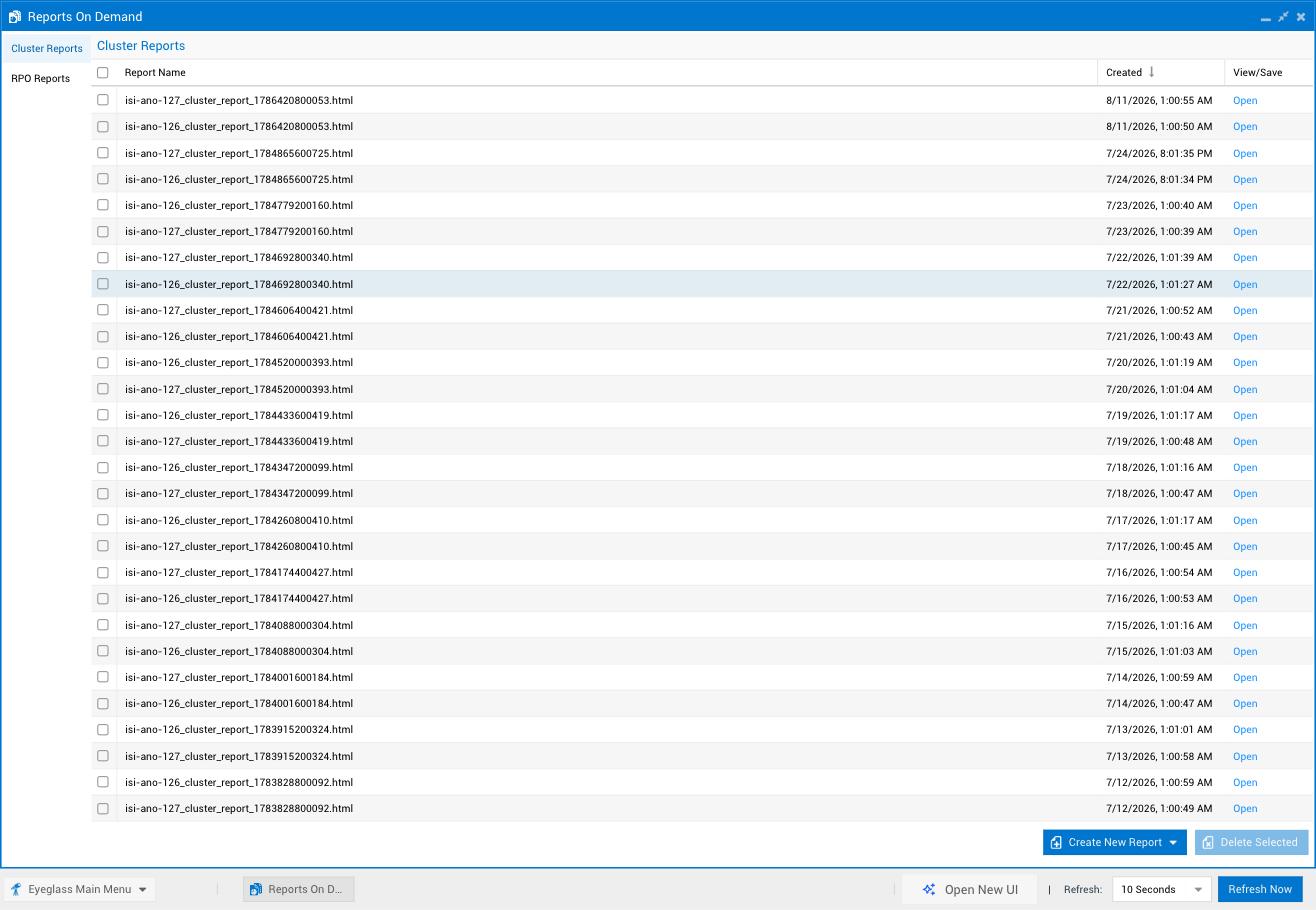
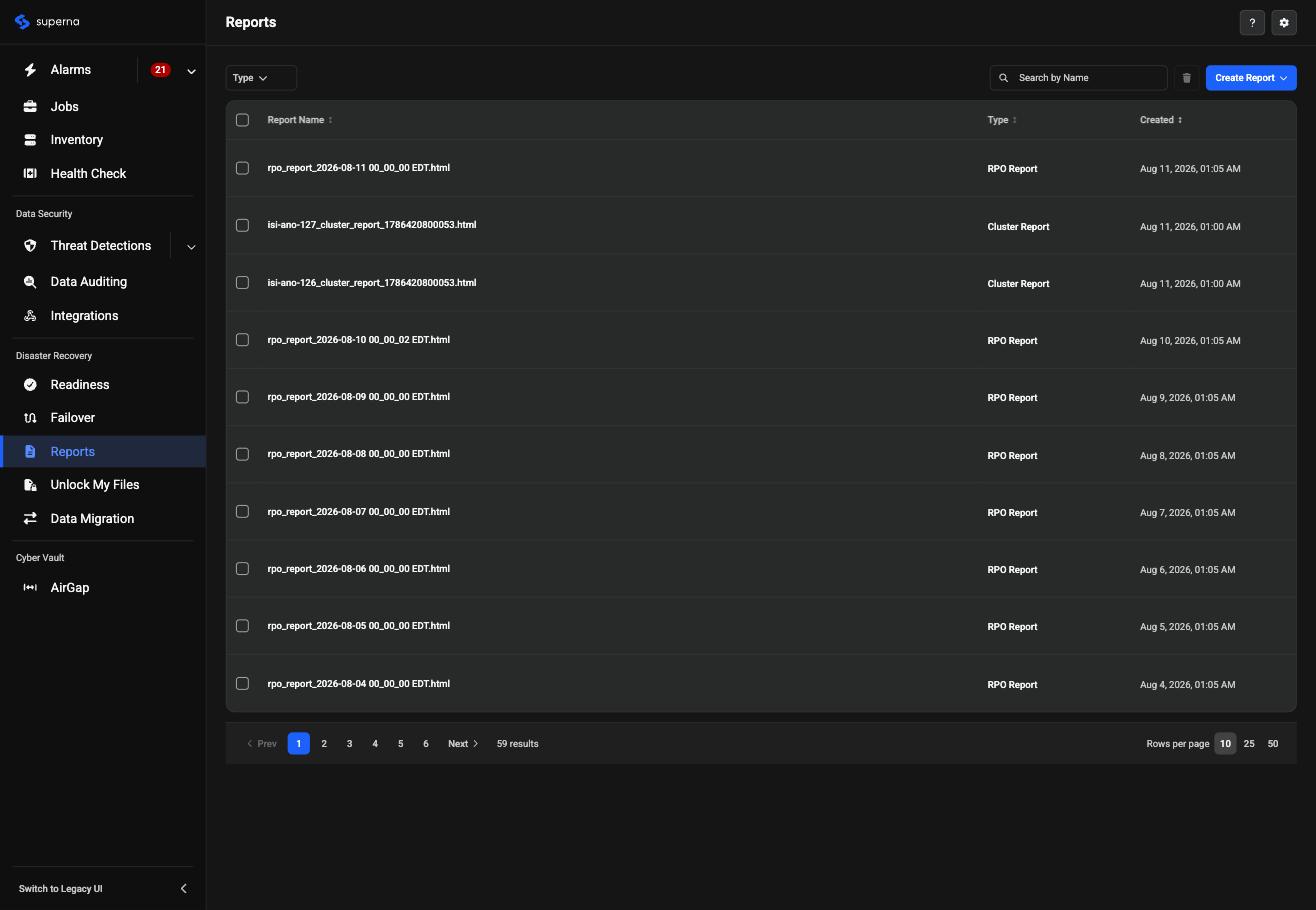
Reports (third item) replaces the legacy Reports On Demand window's Cluster Reports and RPO Reports tabs, consolidating both report types into a single list.
Each row shows the report's file name, its Type (RPO Report or Cluster Report), and its creation timestamp. A Type filter narrows the list, and a search field filters by name. The row-level ... menu (not pictured) replaces the legacy per-row Open link, and a header Create Report button replaces the legacy Create New Report button. Deletion is handled by a trash icon in the page header, acting on whichever rows' checkboxes are selected — there is no separate Delete Selected button and no View Running Jobs confirmation dialog, both present in the legacy UI. See RPO Trending and Reporting for what RPO reports measure.
Drag the slider below to compare the legacy Reports On Demand window with the redesigned Reports page:
Drag the handle to compare — or use the arrow keys when focused.
Unlock My Files
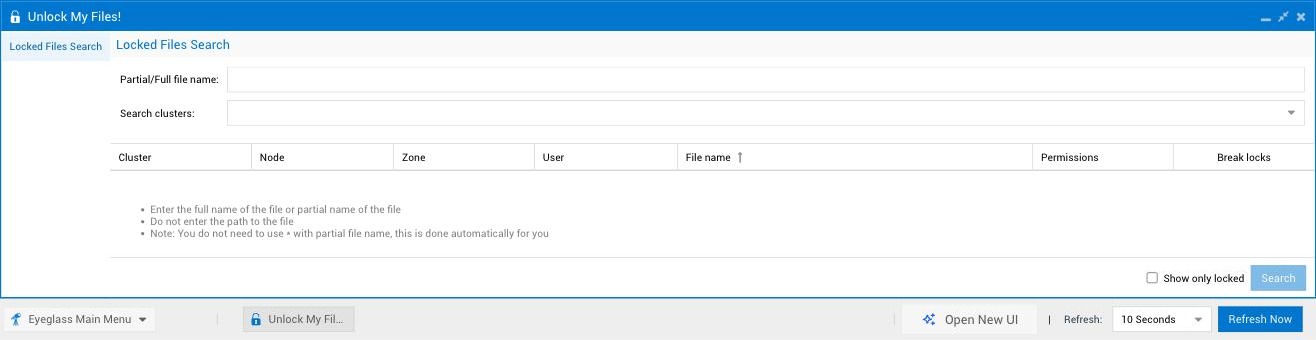
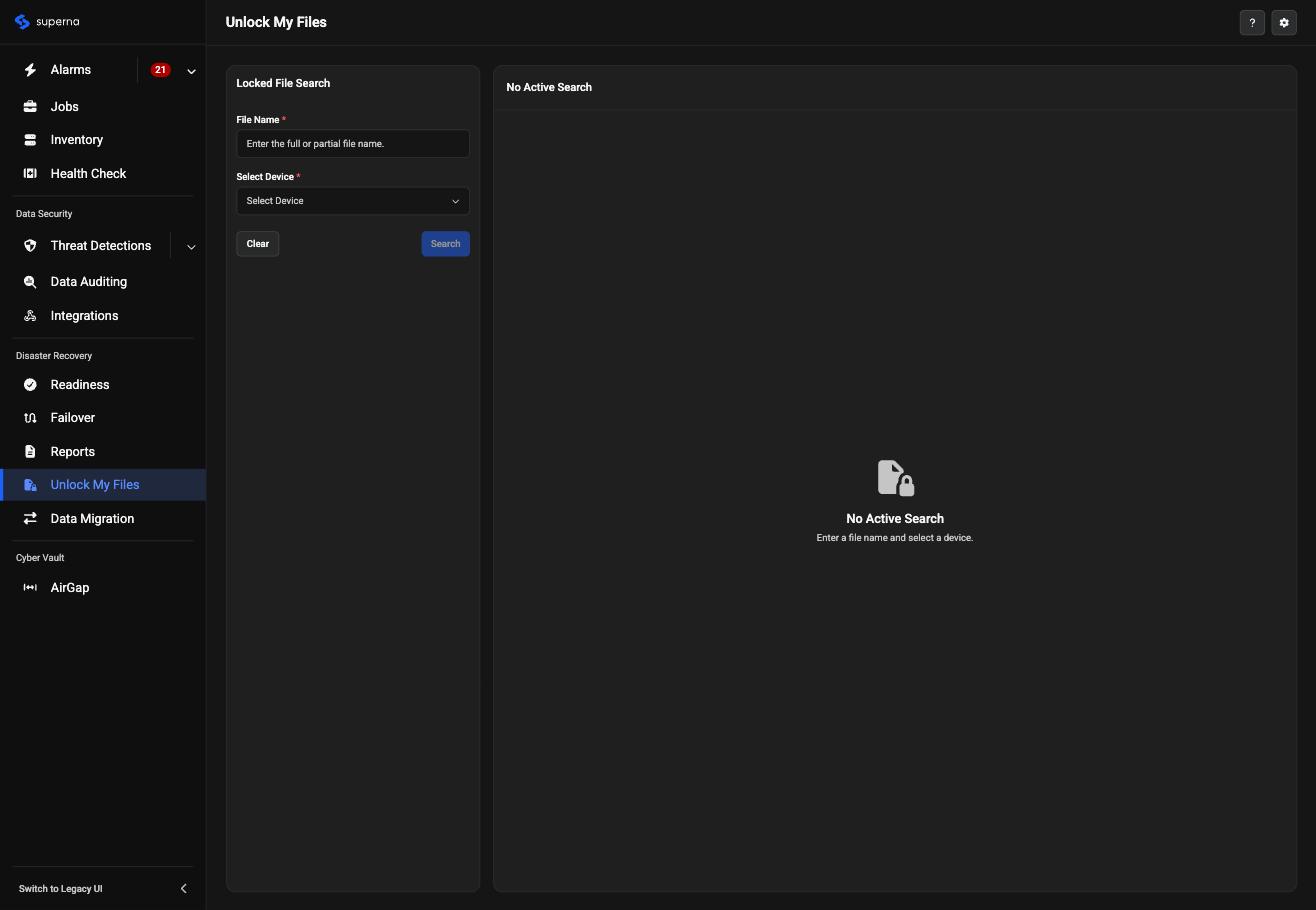
Unlock My Files (fourth item) replaces the legacy Unlock My Files! window's Locked Files Search tab. It is functionally the same locked-file search and release tool described in Unlock My Files, including support for help desk delegation via RBAC.
The Locked File Search panel takes a File Name (full or partial) and a Select Device dropdown (the redesigned equivalent of the legacy Search clusters dropdown), replacing the legacy multi-field form (partial/full file name plus a search-clusters selector). Results appear in the panel on the right once a search is run; the legacy Show only locked checkbox and results table (Cluster, Node, Zone, User, File name, Permissions, Break locks) are expected to appear in this same results panel.
Drag the slider below to compare the legacy Unlock My Files! window with the redesigned Unlock My Files page:
Drag the handle to compare — or use the arrow keys when focused.
Data Migration
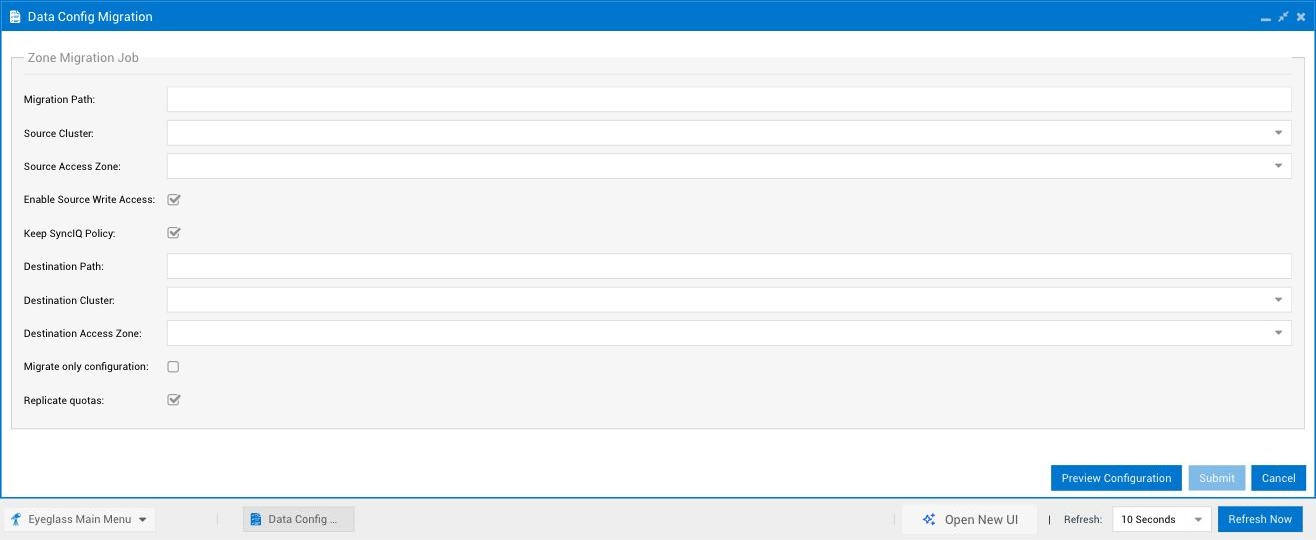
Data Migration (fifth item) replaces the legacy Data Config Migration window's single Zone Migration Job form, described in Data and Config Migration.
The redesigned form keeps every legacy field — Migration Path (now Device & Migration Path, with a Browse button), Source Cluster/Source Access Zone, Destination Path/Destination Cluster/Destination Access Zone, and the Enable Source Write Access, Keep SyncIQ Policy, Migrate Only Configuration, and Replicate Quotas checkboxes — reorganized into clearly labeled Source and Destination sections, each now with inline helper text explaining what each checkbox does. The Preview Configuration button carries over unchanged; Submit and Cancel are now Submit and Clear.
Drag the slider below to compare the legacy Data Config Migration window with the redesigned Data Migration page:
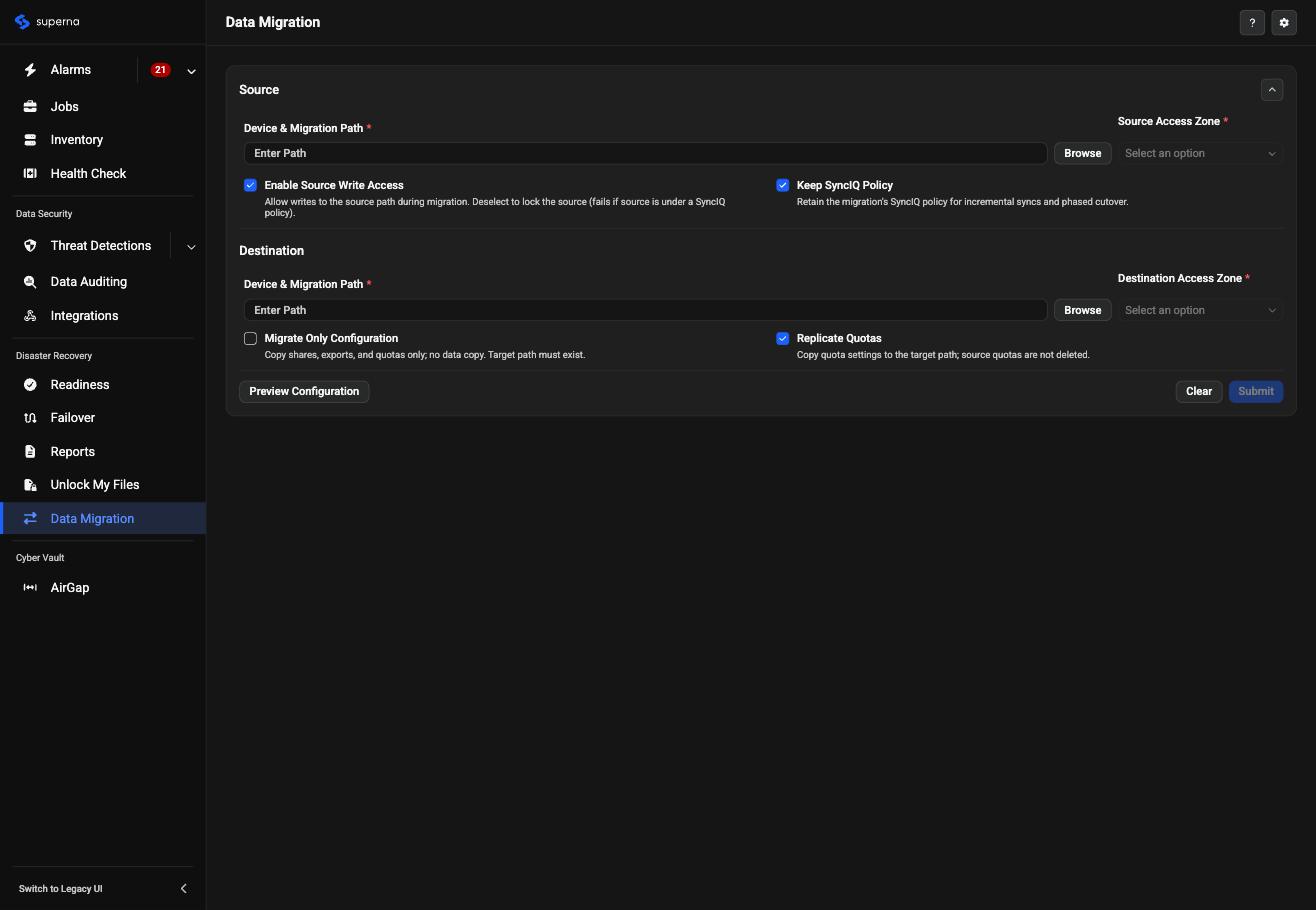
Drag the handle to compare — or use the arrow keys when focused.
Health Check
Health Check (shared, top of sidebar) is where scheduled self-tests and diagnostic tools live. The Overview tab shows a summary card per tool — Security Guard and Robo Audit (pass rate over the last 10 runs, last-run timestamp, schedule, and a Run Now button) and Runbook Robot (run count or a "no runs" state — a Disaster Recovery feature) — plus a Runs calendar heatmap and per-tool run/pass/fail counters for the year. The Manage Services tab lists the ECA Health Check and ECA Monitor services in a Virtual Machine/IP:Port/Eyeglass Token/Service Type table with a Last check-in timestamp. See Runbook Robot in Health Check for Runbook Robot specifics, or Health Check for the full tab-by-tab walkthrough of Security Guard, Robo Audit, and Managed Services, including Runs, Log Parser, and Settings.
Settings
The platform-level Settings page is reached from the gear icon in the top-right corner of any page (next to the help icon), not from the Data Security sidebar — it applies across the whole portal, not just Data Security. Clicking the gear opens a menu with Settings, Mode (theme), and Sign Out; selecting Settings opens a dedicated page with its own left sidebar, organized into General (User Roles & Permissions, Privacy & Compliance) and Notifications (SMTP, Alarm Recipients).
User Roles & Permissions lets you add, manage, and assign roles, with a per-role permissions table (search/toggle individual permissions) and Users/Groups tabs. The User Roles icon on the legacy icon grid is its closest legacy equivalent (see Where things moved below).
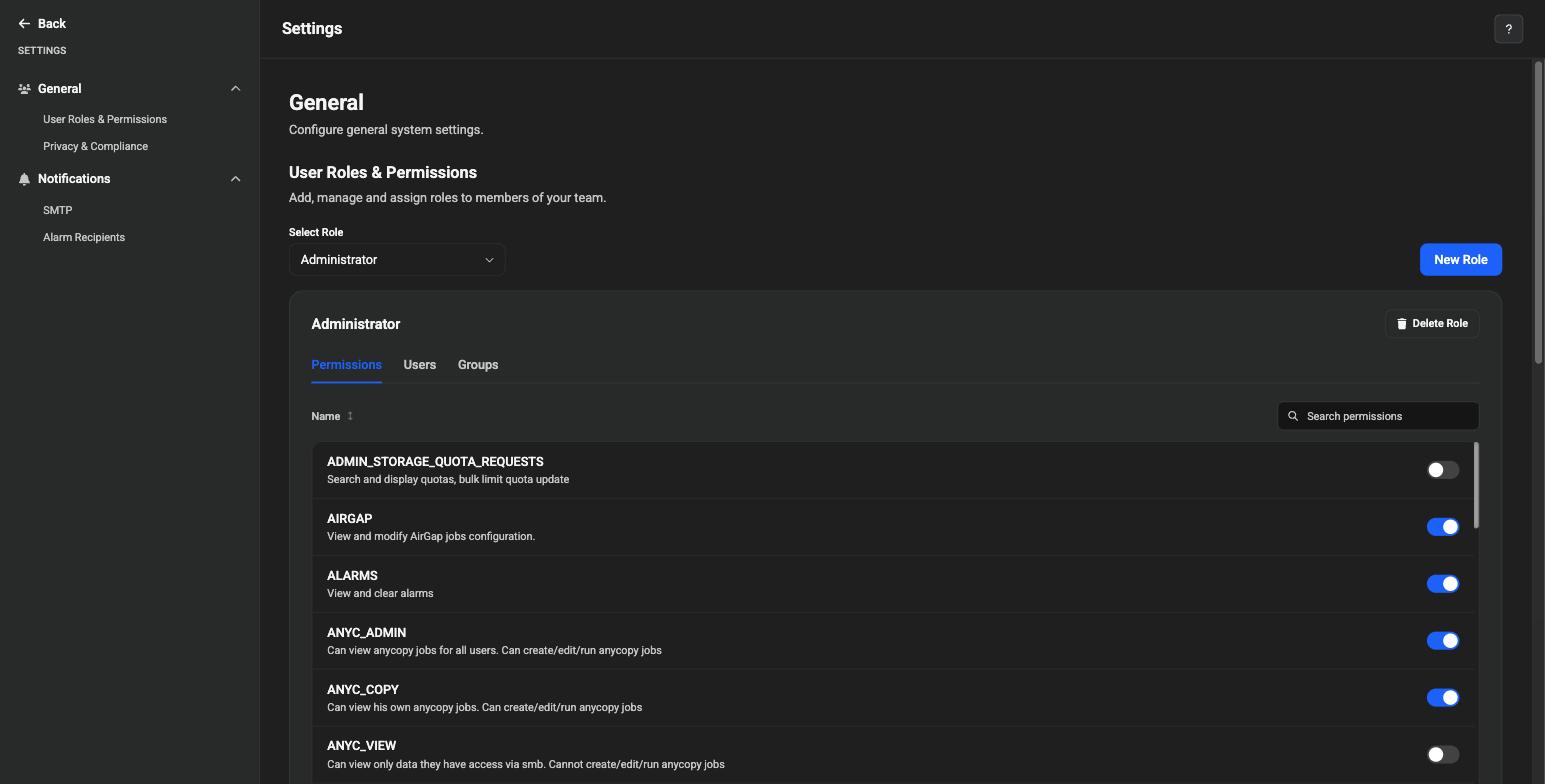
Privacy & Compliance covers the End User License Agreement (EULA) and a Phone Home & Telemetry toggle. Notifications configures how the platform sends email: an SMTP Server table (host, port, authentication), a Test Email sender, and an Alarm Recipients table listing who receives which message types.
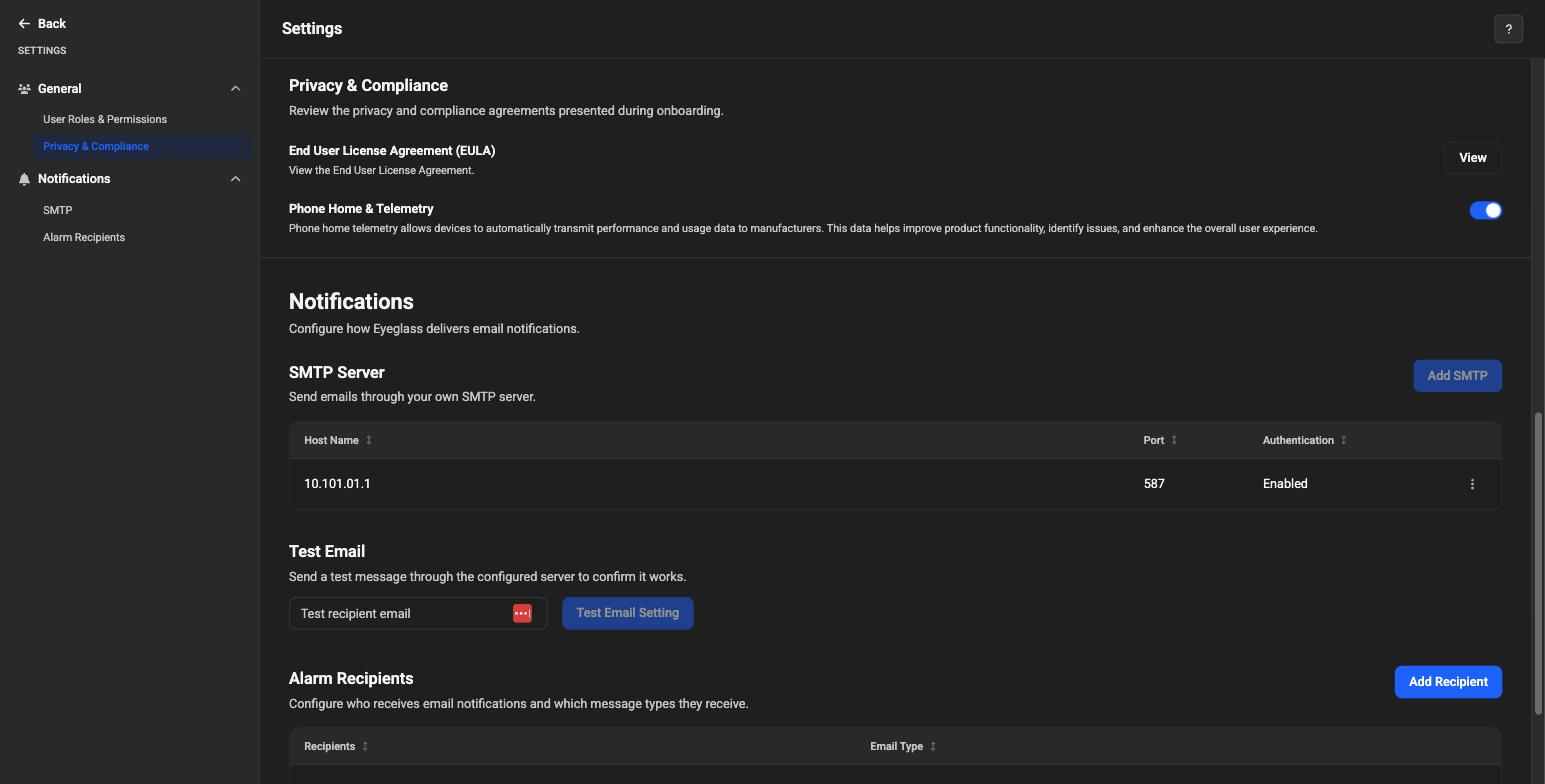
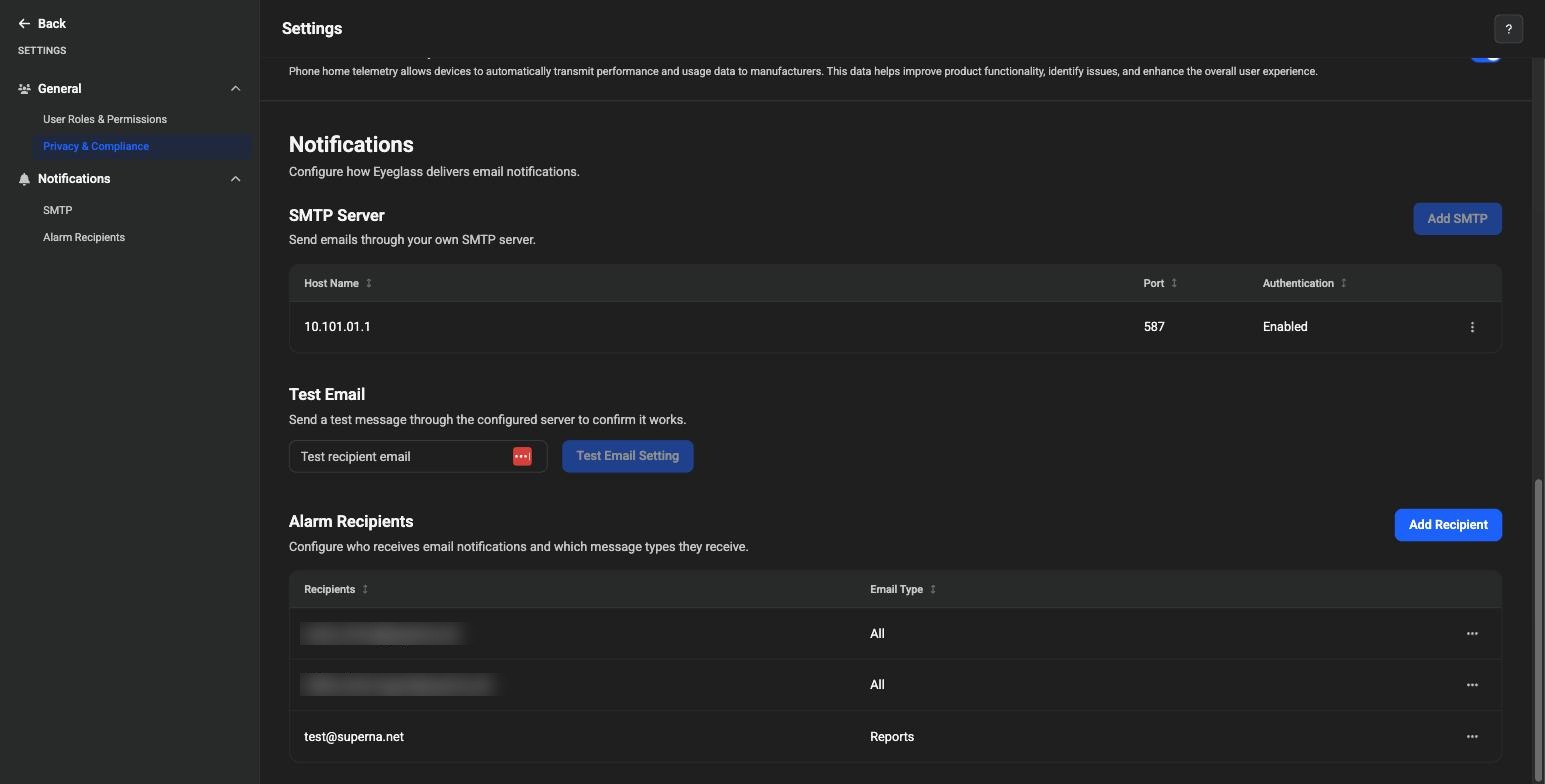
The "Where things moved" table below documents the legacy equivalents for User Roles & Permissions (the legacy User Roles icon) and Privacy & Compliance (the legacy About / Contact icon).
This Settings page is platform-level and identical regardless of which product area you're in when you click the gear icon. It's included here as well as on the Data Security and AirGap New User Experience pages, since it applies across the whole portal rather than to any one product.
Where things moved
If you are coming from the legacy interface, use this table to find familiar tasks in the new navigation:
| Legacy location | New location |
|---|---|
| DR Assistant → Failover Wizard | Failover → header Failover Wizard button |
| DR Assistant → Running Failovers / Failover History | Failover → Runs tab |
| DR Assistant → Writable Snapshots | Failover → Writable Snapshots tab |
| DR Dashboard → Zone Readiness | Readiness → Access Zones tab |
| DR Dashboard → Pool Readiness | Readiness → IP Pools tab |
| DR Dashboard → DFS Readiness | Readiness → Microsoft DFS tab |
| DR Dashboard → Policy Readiness | Readiness → SyncIQ Policy tab |
| DR Assistant / DR Dashboard → LiveOps DR Testing | Deprecated. None of the four Readiness tabs include a dedicated LiveOps/Continuous-Ops sub-tab; see the note under "Readiness" above. |
| Continuous Op Dashboard icon | Inventory → Manage Devices. Per-cluster reachability and detected OneFS version are the closest live equivalents to what the legacy dashboard showed. |
| Reports On Demand → Cluster Reports / RPO Reports | Reports (single combined list, distinguished by the Type column) |
| Unlock My Files! → Locked Files Search | Unlock My Files |
| Data Config Migration → Zone Migration Job | Data Migration |
| Manage Services icon (ECA Monitor / ECA Health Check) | Health Check → Manage Services tab |
| Log Parser icon | Health Check → Log Parser tab |
| Inventory View icon | Inventory (shared, top of sidebar) |
| License Management icon | Inventory → License Management tab |
| Add Managed Device (toolbar icon) | Inventory → Add Device button |
| Alarms icon | Alarms (shared, top of sidebar) — reorganized into Active, Closed, Managed Devices, and Alarm Controls tabs (not a direct carryover of the legacy views). Adds summary cards (active/critical counts, affected devices), filter chips for severity, product, code, and time, a per-row Clear action, and pagination. |
| Jobs icon | Jobs (shared, top of sidebar) — reorganized into Runs and Job Definitions tabs (not a direct carryover of the legacy views). Runs is a master-detail view: a list of job executions on the left, with a Job Tree and Errors panel on the right showing per-step duration, plus Download and Copy actions. |
| User Roles icon | Settings (gear icon on the User Profile menu, top-right) → User Roles & Permissions |
| About / Contact icon | No single equivalent — functionality is split between Inventory → Manage Devices (package/version info) and Settings → Privacy & Compliance (EULA, Phone Home & Telemetry) |
| Cluster Storage Usage icon | Retired. Opening it now shows "This product is deprecated." No 2.15.0 replacement exists. |
| Network Visualization icon | Not yet available in the new interface as of this release. |
| Quickstart icon | No direct equivalent — the legacy icon linked out to the Superna documentation portal rather than an in-app screen. The closest 2.15.0 equivalent is the help (?) icon in the top-right of any page. |
Terminology changes
- DR Assistant and DR Dashboard — two separate legacy windows — are now Failover and Readiness, two items in the same consolidated sidebar.
- Zone Readiness, Pool Readiness, DFS Readiness, and Policy Readiness are renamed Access Zones, IP Pools, Microsoft DFS, and SyncIQ Policy, and live as tabs on one Readiness page instead of four separate legacy tabs.
- Reports On Demand's Cluster Reports and RPO Reports tabs are now a single Reports list, distinguished by a Type column instead of a separate tab per report kind.
- Unlock My Files! (with the exclamation point) is now Unlock My Files; its Search clusters field is now Select Device.
- Data Config Migration is now Data Migration; its Migration Path field is now Device & Migration Path, with an added Browse button.
See also
- Readiness Guide — Monitoring and validating DR readiness in depth.
- LiveOps Continuous Operations Dashboard — Cluster reachability, version, and Continuous Ops Status detail referenced in the Readiness note above.
- Failover Guide — SyncIQ Policy, Access Zone, IP Pool, and DFS failover configuration.
- RPO Trending and Reporting — What RPO reports measure and how they're generated.
- Data and Config Migration — Planning, prerequisites, and post-migration cleanup for migration jobs.
- Unlock My Files — Full reference, including RBAC delegation to help desk roles.
- Data Security's 2.15.0 New User Experience — The equivalent walkthrough for Data Security's redesigned interface.
- AirGap's 2.15.0 New User Experience — The equivalent walkthrough for AirGap's redesigned interface.