2.15.0 New User Experience for AirGap for Dell
About this release
Cyberstorage for Dell 2.15.0 introduces a redesigned interface for AirGap. The legacy Eyeglass-style AirGap icon — a floating window with its own Isilon Config, ECS Sync Config, Job History, AirGap Reports, ECSSync AirGap Job Reports, and Migrate Configuration menu items — has been replaced by a single, consolidated left-hand navigation shared across all Cyberstorage for Dell products, with AirGap itself organized into four tabs: Runs, Reports, Config, and Vault Management. A Switch to Legacy UI link remains available at the bottom of the sidebar for administrators who still need the previous interface during the transition period.
This page is the starting point for learning the 2.15.0 interface for AirGap: the new navigation structure, what each of the four tabs looks like, where familiar legacy tasks moved, and the terminology changes to be aware of.
Navigation overview
The left sidebar is organized into a shared, portal-wide top section and per-product sections below it:
| Sidebar section | Contents |
|---|---|
| Shared (top of sidebar) | Alarms, Jobs, Inventory, Health Check |
| Data Security | Threat Hunting, Threat Detections (with a Detection Controls sub-item), Data Auditing, Integrations |
| Disaster Recovery | Readiness, Failover, Reports, Unlock My Files, Data Migration |
| Cyber Vault | AirGap |
This matches the sidebar structure described on Data Security's 2.15.0 New User Experience. Unlock My Files is located under Disaster Recovery, not Data Security.
A gear icon and a help (?) icon appear in the top-right corner of every page for account/system settings and contextual help, respectively.
Inventory (shared, top of sidebar) is the central view of everything managed by Superna, with three tabs: Manage Devices, License Management, and Backup.
Inventory reflects the last completed inventory collection, not live state — after adding a cluster or making a change, allow 5–10 minutes for the automatic inventory task to run. The page does not auto-refresh; reopen it or use its refresh control to see the latest collection.
Manage Devices is arranged as a hierarchy:
- The core appliance at the top, showing its Operating System, Version, and Status.
- Any Extended Cluster Appliance (ECA) nodes below it, in an expandable section with a Last Check-In timestamp, a View Managed Services button, and its own ECA Node/IP Address/Operating System/Version/Status table.
- The managed storage systems and other devices protected or managed by Superna below that, under a header showing the Effective Version across all managed devices.
Each device row shows the device name and platform, a health indicator showing whether Superna is currently connected to it, and icons for which Superna capabilities are licensed for that device. Expanding a device row shows its Licenses, ID, IP Address, and Version; its row menu offers Launch OneFS, Edit, and Remove.
License Management shows a capacity card per licensed product (Data Security, Disaster Recovery, AirGap) and a table grouped by product with Product, Provider, Type, Platform, Entitlement, Product Expiry, and Support Expiry columns. Product is the Superna product the license was issued for; Platform is the storage platform it applies to (PowerScale or ECS/ObjectScale).
Backup lists backup archives (Archive Name, Type, Date Created, Size) with a Create Backup dialog offering two backup types — Full Backup (configuration, policies, and job history) and Support Bundle (lightweight diagnostics with logs and config) — plus an Include cluster reports toggle, alongside a Send to Support action for selected archives.
Health Check (shared, top of sidebar) is where scheduled self-tests and diagnostic tools live, with five tabs:
- Overview — a summary card per tool: Security Guard and Robo Audit (pass rate over the last 10 runs, last-run timestamp, schedule, and a Run Now button) and Runbook Robot (run count or a "no runs" state — a Disaster Recovery feature) — plus a Runs calendar heatmap and per-tool run/pass/fail counters for the year.
- Runs — a master-detail view like Jobs: a filterable list of individual health-check executions on the left (Status, Job Type, and Date filters, plus search) with a Job Tree/Errors panel on the right and Download/Copy actions.
- Manage Services — one row per ECA node plus Eyeglass itself, in a Virtual Machine/IP:Port/Eyeglass Token/Service Type table with a Last check-in timestamp; toggle between the ECA Health Check and ECA Monitor views above the table (ECA Monitor opens a Grafana dashboard of event rate per ECA).
- Log Parser — manages uploaded backup files used to generate Log Parser reports (Customer/Appliance ID/Upload Date/Status table, search, bulk Delete, and an Add Backup button — backups themselves are generated from Inventory).
- Settings — lets you configure each tool individually: an enable/disable toggle and Run Now button per tool, plus tool-specific configuration such as Security Guard's Active Directory user credentials, target managed device, and run interval.
Runs
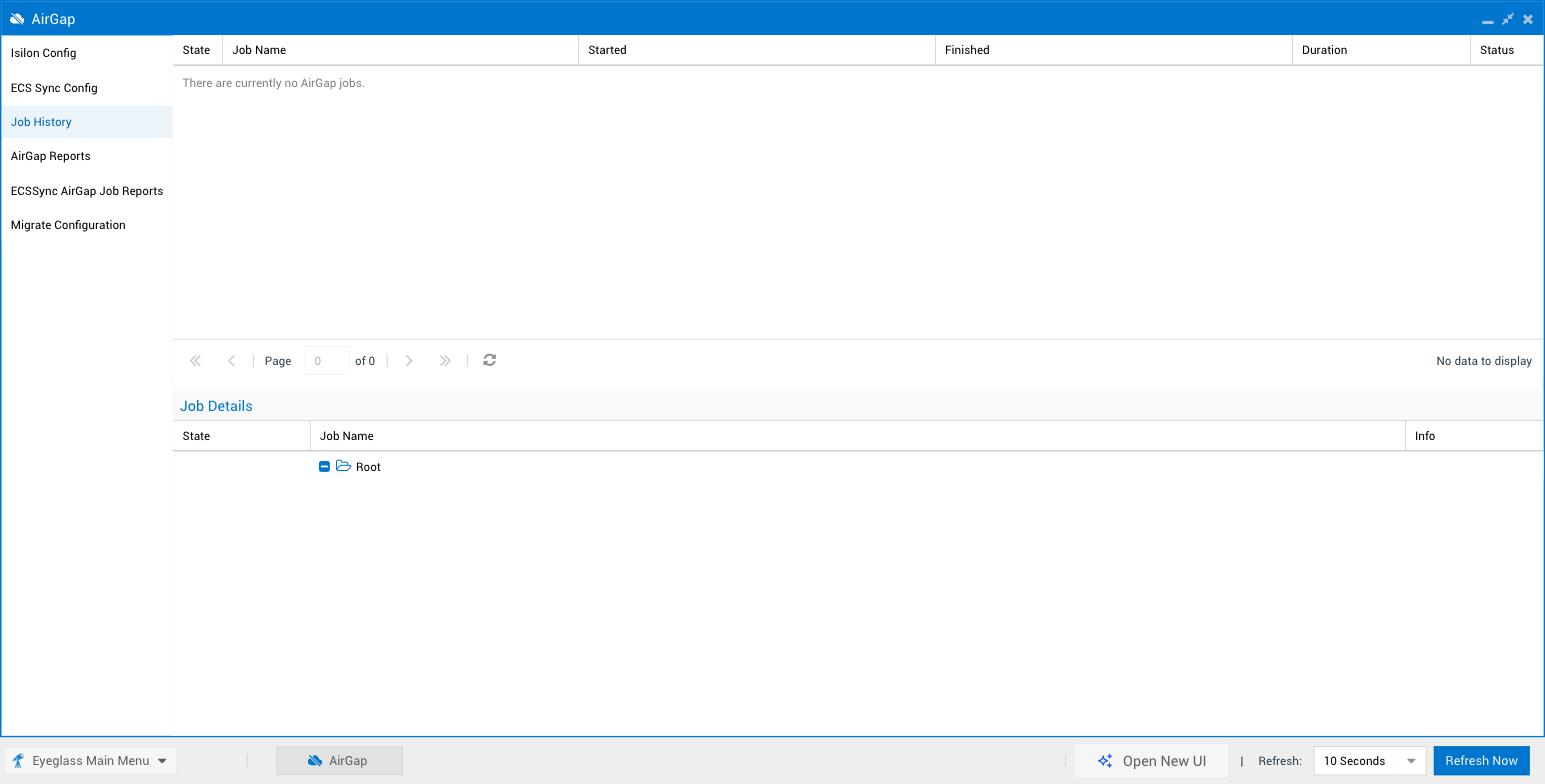
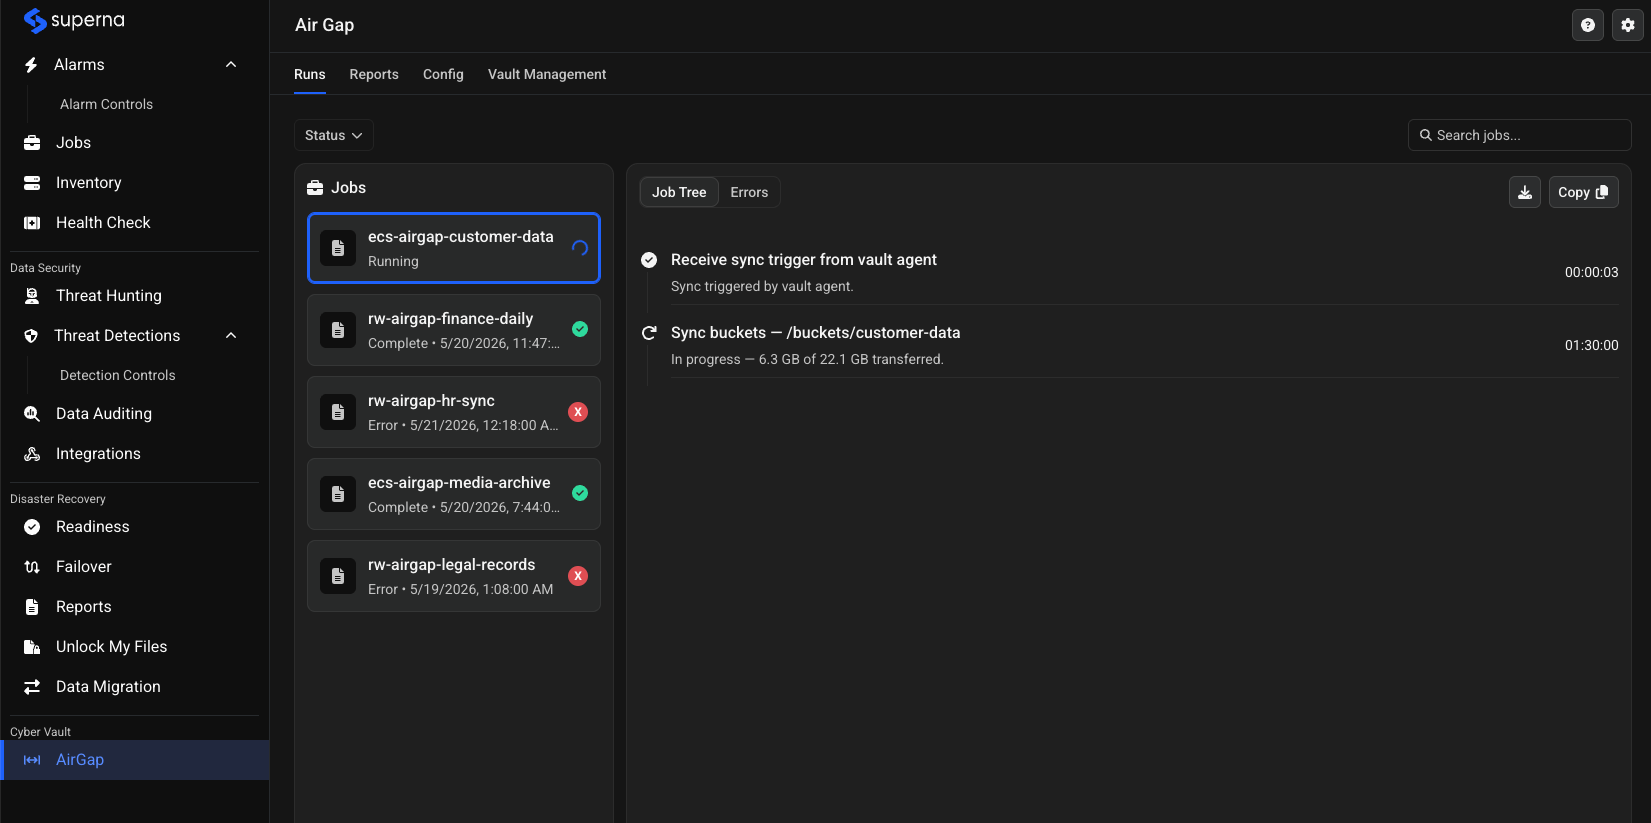
Runs (first tab) replaces the legacy Job History view, previously reached from the AirGap icon and documented in Vault Agent Scheduler — Display Job History from the Vault Agent.
The Jobs list on the left shows each replication job's name and current state (Running, Complete, or Error). Selecting a job opens a Job Tree panel on the right showing its steps in sequence — for example, "Receive sync trigger from vault agent" followed by "Sync buckets — /path", each with elapsed time and, for in-progress steps, a live transferred-data count. An Errors tab (alongside Job Tree) is also available for jobs that failed. A Status filter narrows the list to Queued, Running, Complete, Errors, or Canceled jobs, and a search field filters by job name. Drag the slider below to compare the legacy Job History view with the redesigned Runs tab:
Drag the handle to compare — or use the arrow keys when focused.
Reports
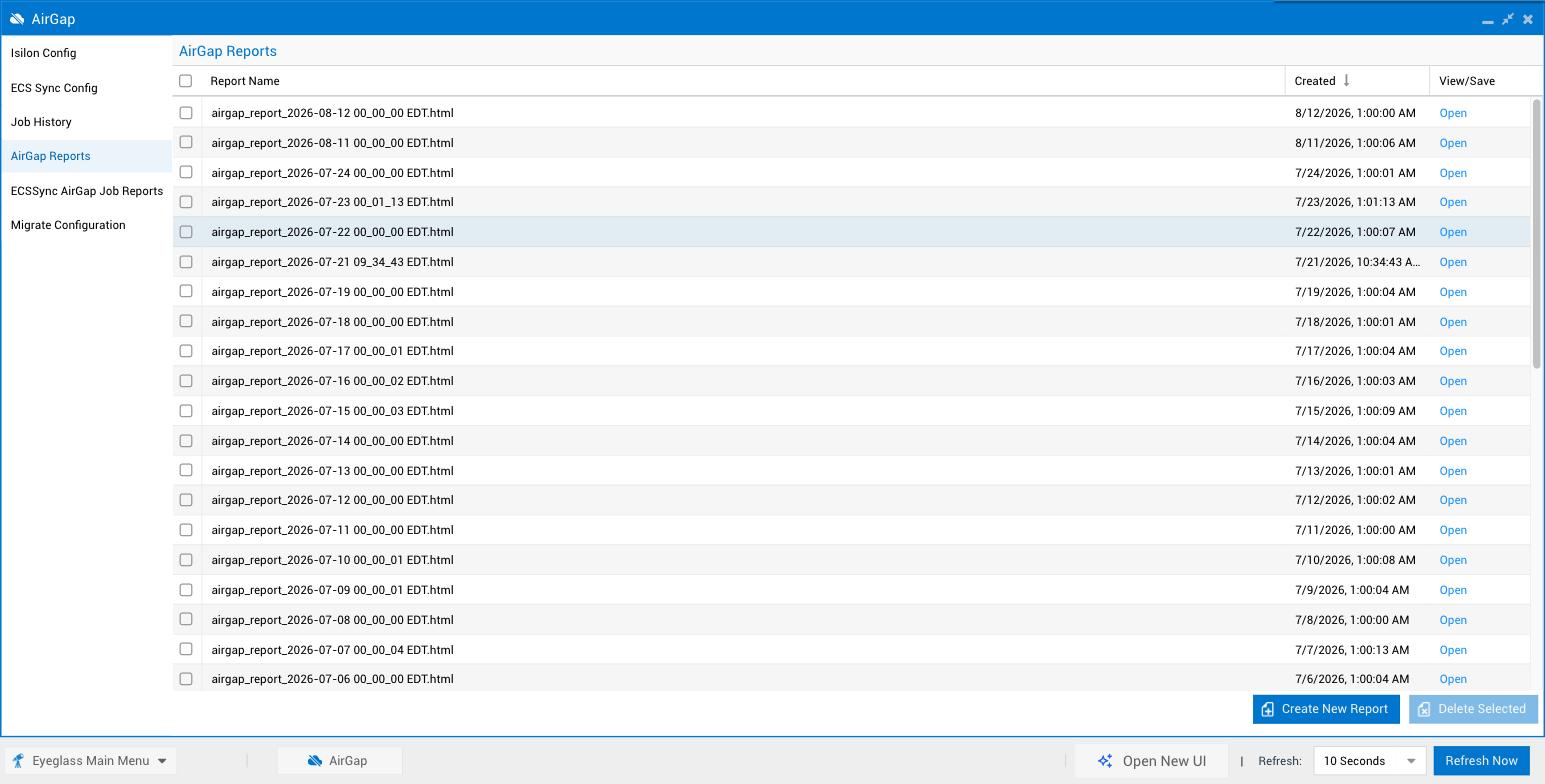
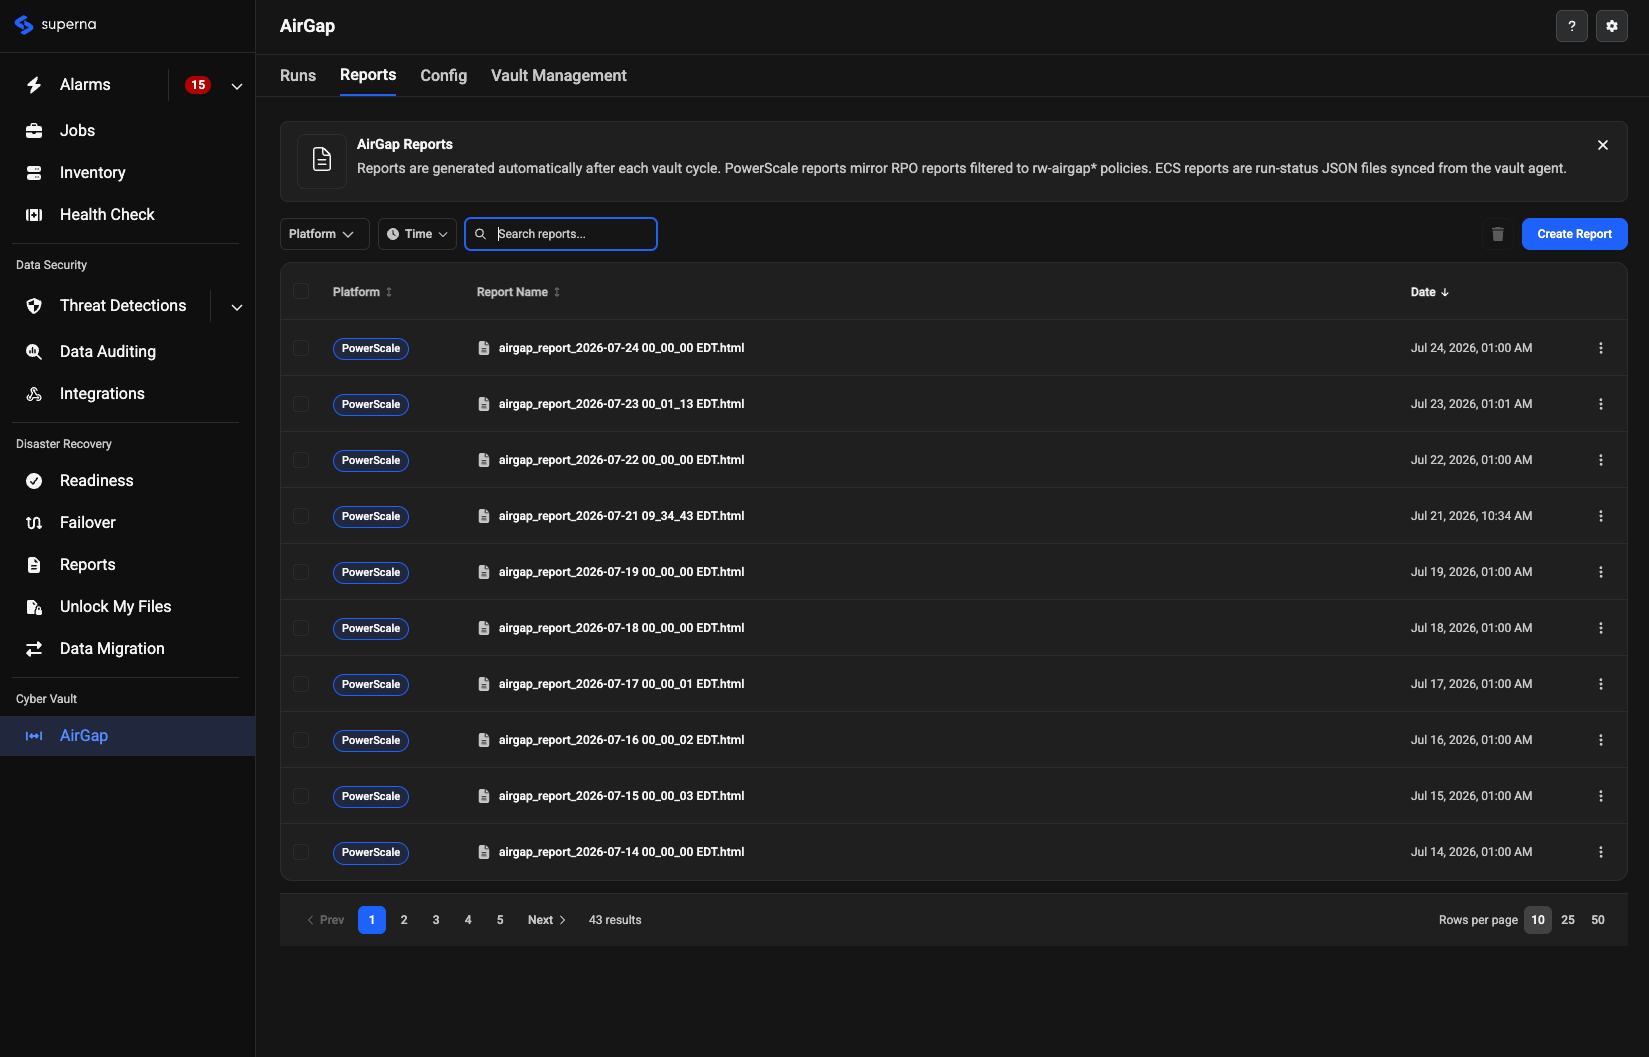
Reports (second tab) replaces the legacy AirGap Reports and ECSSync AirGap Job Reports menu items. As described in the AirGap FAQ, AirGap provides full 24-hour, 30-day, and 60-day reporting on all copy jobs, including success/failure counts, throughput, and average AirGap-open time; the 2.15.0 Reports tab is where that reporting is reviewed on demand (it can also be received daily by email, per the same FAQ entry).
Drag the handle to compare — or use the arrow keys when focused.
Each row is a generated report file, labeled by platform (PowerScale or ECS/ObjectScale) with a date-stamped name. A Platform filter narrows by PowerScale or ECS/ObjectScale, and a Time filter narrows to a relative window (In the Last / Date / Between). The row-level menu offers Download, View Report, and Delete. A Create Report button opens a dialog to generate an on-demand report for a specific Start time/End time range. The legacy AirGap window also has a separate ECSSync AirGap Job Reports tab, not pictured in the comparison below.
PowerScale reports mirror RPO reports filtered to rw-airgap* policies; ECS reports are run-status JSON files synced from the vault agent, per the in-app description on this tab.
Config
Config (third tab) replaces the legacy Isilon Config and ECS Sync Config tabs (see AirGap for ECS — Access ECS Sync Config Tab), consolidating both platforms into a single table.
Configurations are auto-discovered from rw-airgap* policies on PowerScale, or from vault agent sync on ECS — they are not created manually on this tab. Each row shows the source and destination cluster, the replication schedule (or Not Scheduled if none is set), a status badge (OK, Error, Complete, Running, or NotStarted), and an Active toggle. Platform and Active filters narrow the table (there is no separate Source filter), and the row-level ... menu offers Set Schedule and Migrate actions — the same change made by the CLI equivalent, igls airgap schedule set --job <name> --cronstr '<cron>'. An Eyeglass Managed Schedules button and a Migrate button are also available in the table header, for reviewing schedules set via the legacy Eyeglass scheduler and for bulk migration, respectively. This tab replaces the legacy Isilon Config and ECS Sync Config tabs. Drag the slider below to compare the legacy and redesigned pages:
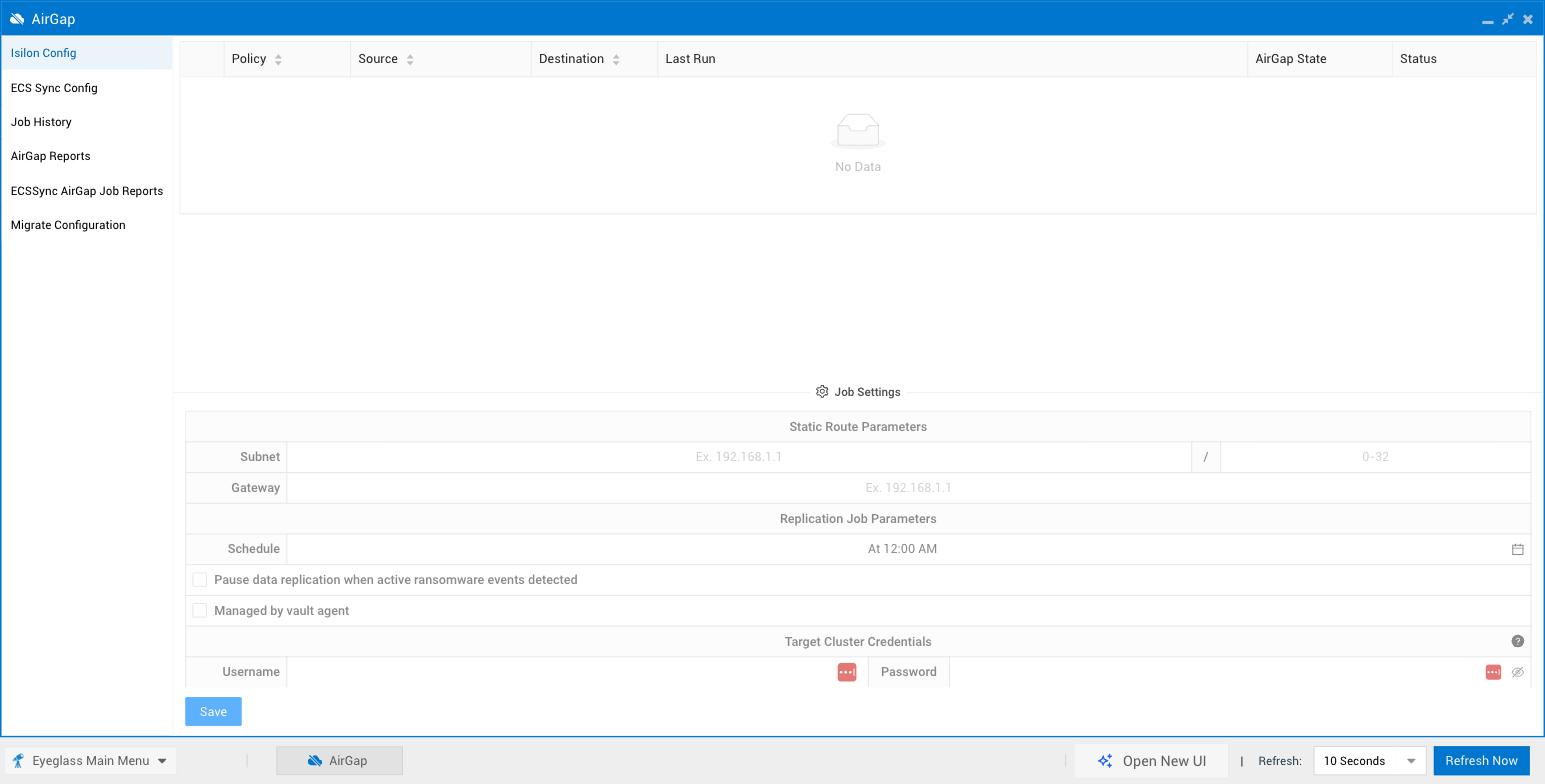
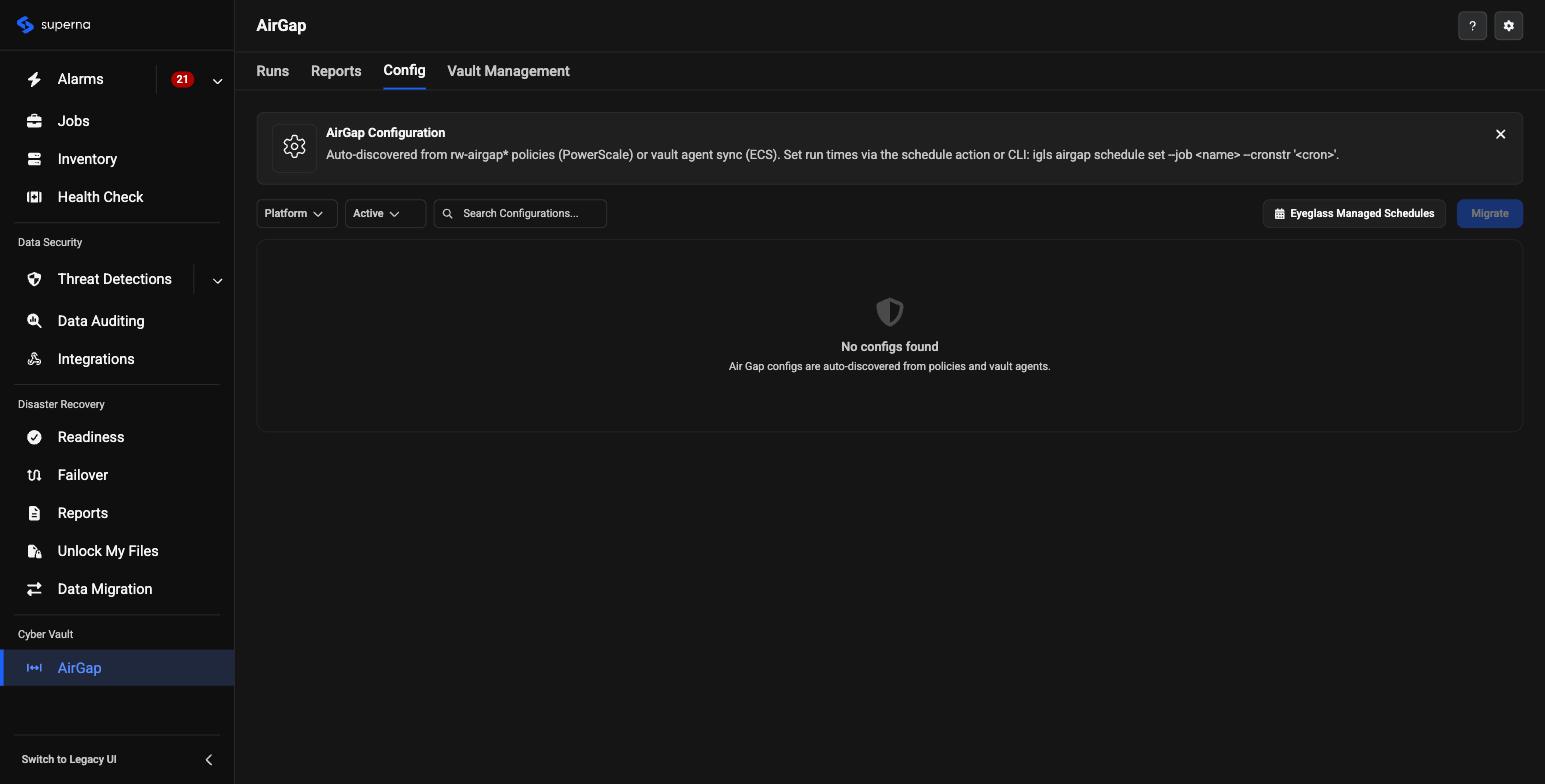
Drag the handle to compare — or use the arrow keys when focused.
Vault Management
Vault Management (fourth tab) does not have a direct legacy equivalent — it does not correspond to any menu item on the legacy AirGap icon documented in this portal today.
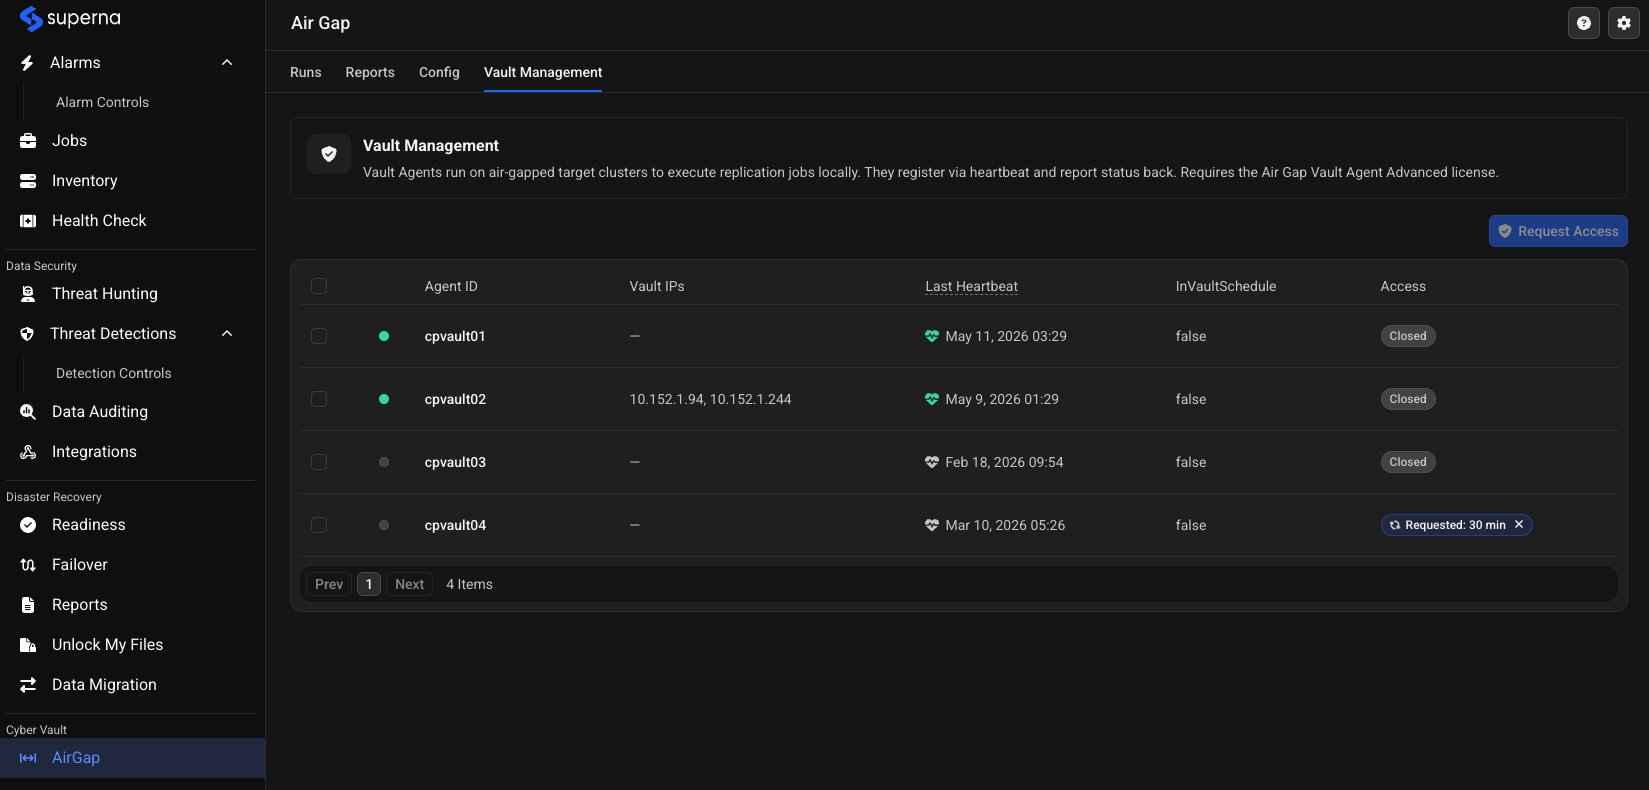
Vault Agents run on air-gapped target clusters to execute replication jobs locally; they register with Eyeglass via heartbeat and report status back. This tab requires the Air Gap Vault Agent Advanced license. Each row shows the agent's ID, the vault IP(s) it's reachable on (when access is open), its last heartbeat time, whether it's included in vault-controlled scheduling (InVaultSchedule), and its current Access state (Closed, Requested, or Open). Selecting one or more agents and clicking Request Access opens a time-limited access window.
The InVaultSchedule column reflects whether the agent is included in the CLI-based Vault Control mode schedule (ecactl airgap invaultschedule, igls airgap invaultschedule) — see Vault Agent Scheduler.
Health Check
Health Check (shared, top of sidebar) is where scheduled self-tests and diagnostic tools live. The Overview tab shows a summary card per tool — Security Guard and Robo Audit (pass rate over the last 10 runs, last-run timestamp, schedule, and a Run Now button) and Runbook Robot (run count or a "no runs" state — a Disaster Recovery feature) — plus a Runs calendar heatmap and per-tool run/pass/fail counters for the year. The Manage Services tab lists the ECA Health Check and ECA Monitor services in a Virtual Machine/IP:Port/Eyeglass Token/Service Type table with a Last check-in timestamp. See Health Check for the full tab-by-tab walkthrough, including Runs, Log Parser, and Settings.
Settings
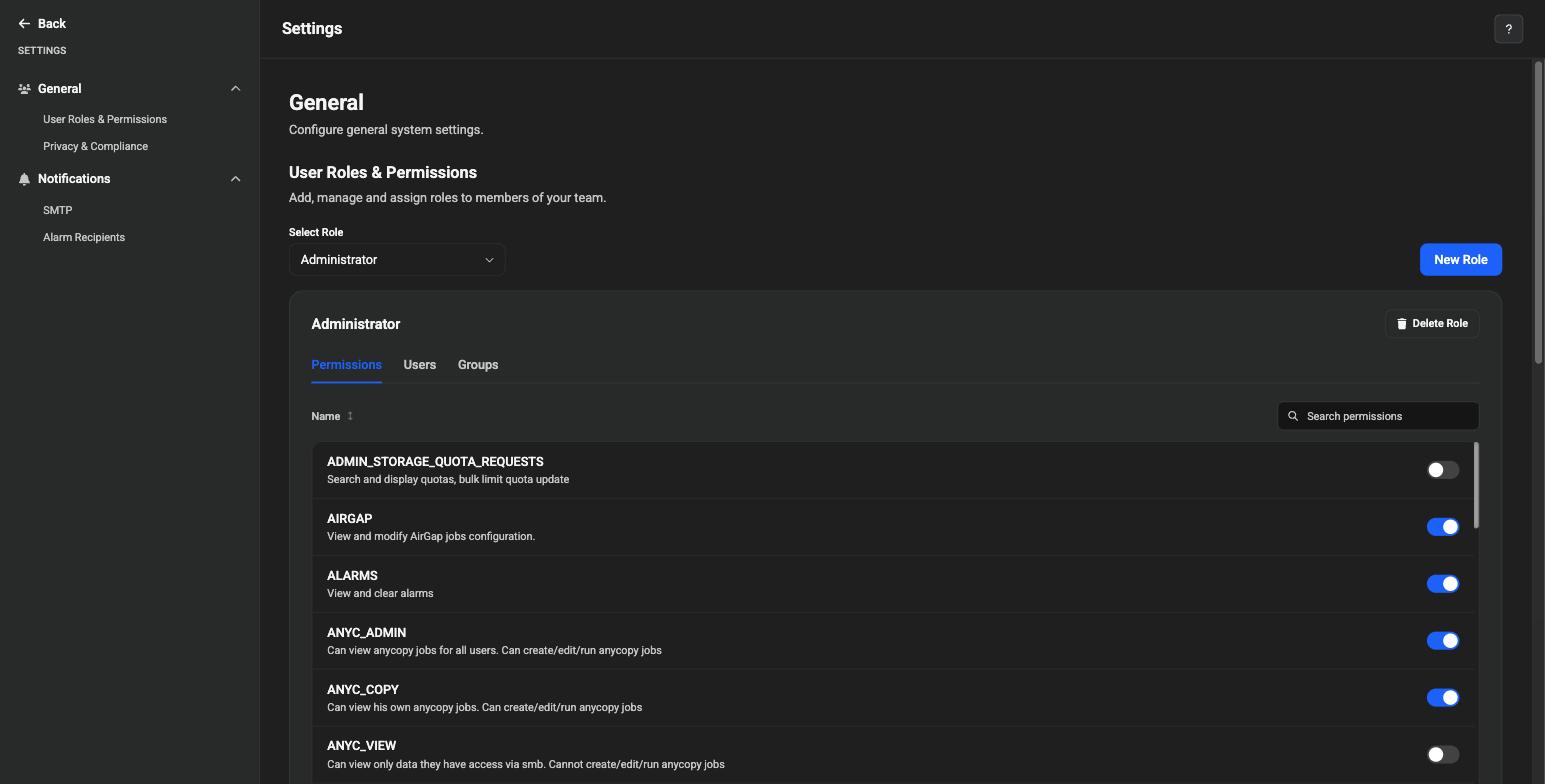
The platform-level Settings page is reached from the gear icon in the top-right corner of any page (next to the help icon), not from the Data Security sidebar — it applies across the whole portal, not just Data Security. Clicking the gear opens a menu with Settings, Mode (theme), and Sign Out; selecting Settings opens a dedicated page with its own left sidebar, organized into General (User Roles & Permissions, Privacy & Compliance) and Notifications (SMTP, Alarm Recipients).
User Roles & Permissions lets you add, manage, and assign roles, with a per-role permissions table (search/toggle individual permissions) and Users/Groups tabs. The User Roles icon on the legacy icon grid is its closest legacy equivalent (see Where things moved below).
Privacy & Compliance covers the End User License Agreement (EULA) and a Phone Home & Telemetry toggle. Notifications configures how the platform sends email: an SMTP Server table (host, port, authentication), a Test Email sender, and an Alarm Recipients table listing who receives which message types.
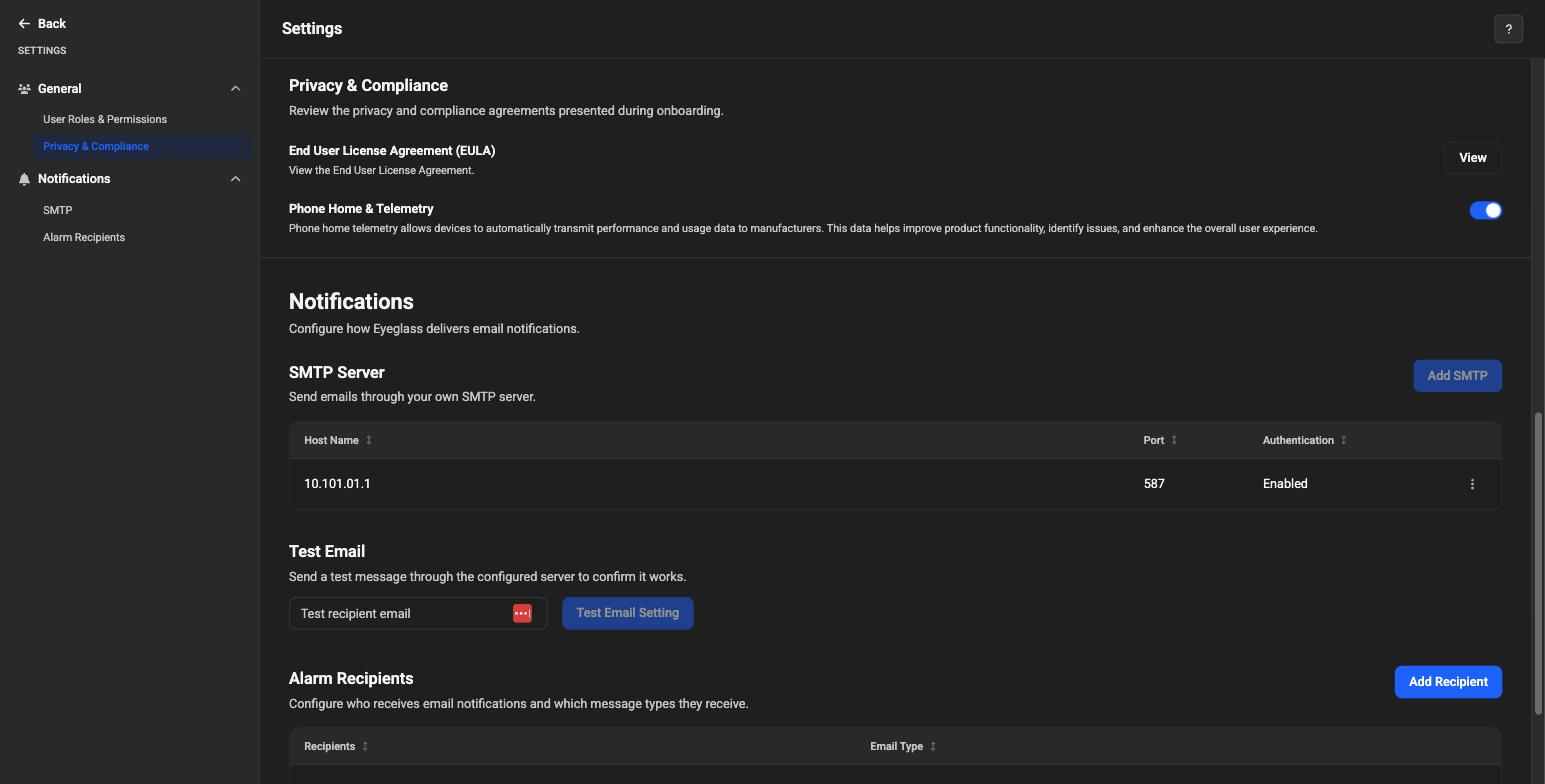
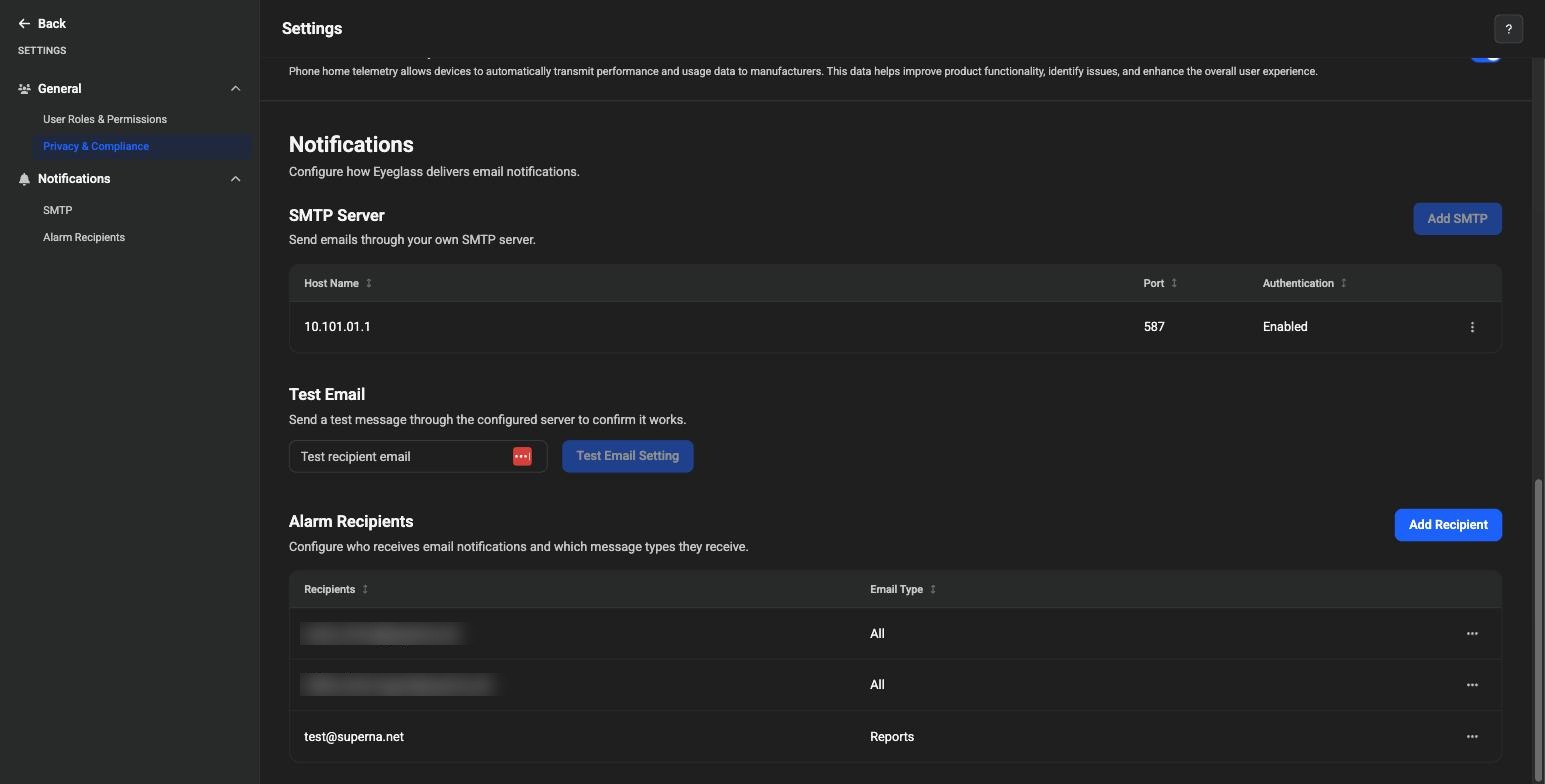
The "Where things moved" table below documents the legacy equivalents for User Roles & Permissions (the legacy User Roles icon) and Privacy & Compliance (the legacy About / Contact icon).
This Settings page is platform-level and identical regardless of which product area you're in when you click the gear icon. It's included here as well as on the Data Security and Disaster Recovery New User Experience pages, since it applies across the whole portal rather than to any one product.
Where things moved
If you are coming from the legacy interface, use this table to find familiar tasks in the new navigation:
| Legacy location | New location |
|---|---|
| AirGap icon → Isilon Config tab | Config tab (PowerScale rows) |
| AirGap icon → ECS Sync Config tab | Config tab (ECS/ObjectScale rows) |
AirGap icon → Job History (ecactl airgap history, igls airgap ...) | Runs tab |
| AirGap icon → AirGap Reports / ECSSync AirGap Job Reports | Reports tab |
| AirGap icon → Migrate Configuration | Config tab → row ... menu Migrate action, or the header Migrate button |
| — | Vault Management tab (new in 2.15.0 — no legacy equivalent) |
| Manage Services icon (ECA Monitor / ECA Health Check) | Health Check → Manage Services tab |
| Log Parser icon | Health Check → Log Parser tab |
| Inventory View icon | Inventory (shared, top of sidebar) |
| License Management icon | Inventory → License Management tab |
| Add Managed Device (toolbar icon) | Inventory → Add Device button |
| Alarms icon | Alarms (shared, top of sidebar) — reorganized into Active, Closed, Managed Devices, and Alarm Controls tabs (not a direct carryover of the legacy views). Adds summary cards (active/critical counts, affected devices), filter chips for severity, product, code, and time, a per-row Clear action, and pagination. |
| Jobs icon | Jobs (shared, top of sidebar) — reorganized into Runs and Job Definitions tabs (not a direct carryover of the legacy views). Runs is a master-detail view: a list of job executions on the left, with a Job Tree and Errors panel on the right showing per-step duration, plus Download and Copy actions. |
| User Roles icon | Settings (gear icon on the User Profile menu, top-right) → User Roles & Permissions |
| About / Contact icon | No single equivalent — functionality is split between Inventory → Manage Devices (package/version info) and Settings → Privacy & Compliance (EULA, Phone Home & Telemetry) |
| Cluster Storage Usage icon | Retired. Opening it now shows "This product is deprecated." No 2.15.0 replacement exists. |
| Network Visualization icon | Not yet available in the new interface as of this release. |
| Quickstart icon | No direct equivalent — the legacy icon linked out to the Superna documentation portal rather than an in-app screen. The closest 2.15.0 equivalent is the help (?) icon in the top-right of any page. |
Terminology changes
- The separate Isilon Config and ECS Sync Config tabs are now a single Config tab, with Platform as a column and filter instead of a separate screen per platform.
- AirGap Reports and ECSSync AirGap Job Reports are now a single Reports tab, also distinguished by a Platform column and filter.
- Job History is now the Runs tab.
- The legacy AirGap State column is not shown by that name on the new Config tab; the closest equivalents are the Status and Active columns.
- Vault Management is a new tab in 2.15.0 with no direct legacy equivalent.
See also
- Vault Agent Scheduler — Vault Control mode, job history, and scheduling behavior.
- AirGap for ECS — Configuring AirGap for ECS/ObjectScale, including the legacy ECS Sync Config workflow.
- AirGap for Dell — Frequently Asked Questions — Reporting cadence and other operational questions.
- Data Security's 2.15.0 New User Experience — The equivalent walkthrough for Data Security's redesigned interface.