2.15.0 New User Experience for Data Security for Dell
About this release
Cyberstorage for Dell 2.15.0 introduces a redesigned interface for Data Security. The legacy Eyeglass-style UI — individual application icons such as "Ransomware Defender" and "Easy Auditor," each with their own separate Settings screens — has been replaced by a single, consolidated left-hand navigation shared across all Cyberstorage for Dell products. A Switch to Legacy UI link remains available at the bottom of the sidebar for administrators who still need the previous interface during the transition period.
This page is the starting point for learning the 2.15.0 interface: the new navigation structure, what each redesigned Data Security page looks like, where familiar legacy tasks moved, and the terminology changes to be aware of.
Navigation overview
The left sidebar is organized into a shared, portal-wide top section and per-product sections below it:
| Sidebar section | Contents |
|---|---|
| Shared (top of sidebar) | Alarms, Jobs, Inventory, Health Check |
| Data Security | Threat Hunting*, Threat Detections (with a Detection Controls sub-item), Data Auditing, Integrations |
| Disaster Recovery | Readiness, Failover, Reports, Unlock My Files, Data Migration |
| Cyber Vault | AirGap |
* Threat Hunting is included in your subscription license for Data Security Edition — it requires its own ML VM, and will show up in the Data Security sidebar once that component has been installed. If you don't see it in your environment, it likely hasn't been deployed yet. For the Threat Hunting screens and full walkthrough, see Threat Hunting.
A gear icon and a help (?) icon appear in the top-right corner of every page for account/system settings and contextual help, respectively.
Inventory (shared, top of sidebar) is the central view of everything managed by Superna, with three tabs: Manage Devices, License Management, and Backup.
Inventory reflects the last completed inventory collection, not live state — after adding a cluster or making a change, allow 5–10 minutes for the automatic inventory task to run. The page does not auto-refresh; reopen it or use its refresh control to see the latest collection.
Manage Devices is arranged as a hierarchy:
- The core appliance at the top, showing its Operating System, Version, and Status.
- Any Extended Cluster Appliance (ECA) nodes below it, in an expandable section with a Last Check-In timestamp, a View Managed Services button, and its own ECA Node/IP Address/Operating System/Version/Status table.
- The managed storage systems and other devices protected or managed by Superna below that, under a header showing the Effective Version across all managed devices.
Each device row shows the device name and platform, a health indicator showing whether Superna is currently connected to it, and icons for which Superna capabilities are licensed for that device. Expanding a device row shows its Licenses, ID, IP Address, and Version; its row menu offers Launch OneFS, Edit, and Remove.
License Management shows a capacity card per licensed product (Data Security, Disaster Recovery, AirGap) and a table grouped by product with Product, Provider, Type, Platform, Entitlement, Product Expiry, and Support Expiry columns. Product is the Superna product the license was issued for; Platform is the storage platform it applies to (PowerScale or ECS/ObjectScale).
Backup lists backup archives (Archive Name, Type, Date Created, Size) with a Create Backup dialog offering two backup types — Full Backup (configuration, policies, and job history) and Support Bundle (lightweight diagnostics with logs and config) — plus an Include cluster reports toggle, alongside a Send to Support action for selected archives.
Health Check (shared, top of sidebar) is where scheduled self-tests and diagnostic tools live, with five tabs:
- Overview — a summary card per tool: Security Guard and Robo Audit (pass rate over the last 10 runs, last-run timestamp, schedule, and a Run Now button) and Runbook Robot (run count or a "no runs" state — a Disaster Recovery feature) — plus a Runs calendar heatmap and per-tool run/pass/fail counters for the year.
- Runs — a master-detail view like Jobs: a filterable list of individual health-check executions on the left (Status, Job Type, and Date filters, plus search) with a Job Tree/Errors panel on the right and Download/Copy actions.
- Manage Services — one row per ECA node plus Eyeglass itself, in a Virtual Machine/IP:Port/Eyeglass Token/Service Type table with a Last check-in timestamp; toggle between the ECA Health Check and ECA Monitor views above the table (ECA Monitor opens a Grafana dashboard of event rate per ECA).
- Log Parser — manages uploaded backup files used to generate Log Parser reports (Customer/Appliance ID/Upload Date/Status table, search, bulk Delete, and an Add Backup button — backups themselves are generated from Inventory).
- Settings — lets you configure each tool individually: an enable/disable toggle and Run Now button per tool, plus tool-specific configuration such as Security Guard's Active Directory user credentials, target managed device, and run interval.
Threat Detections
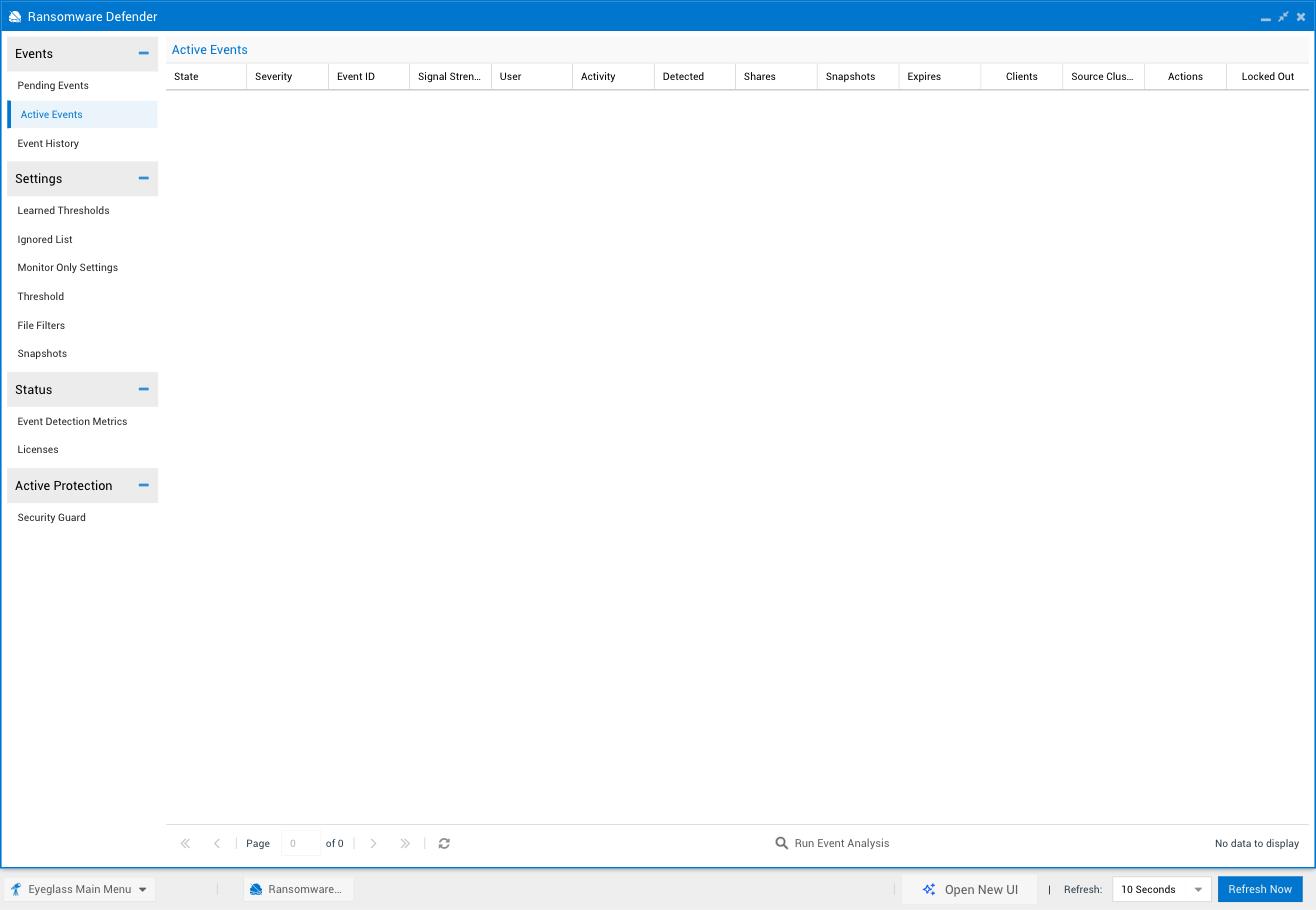
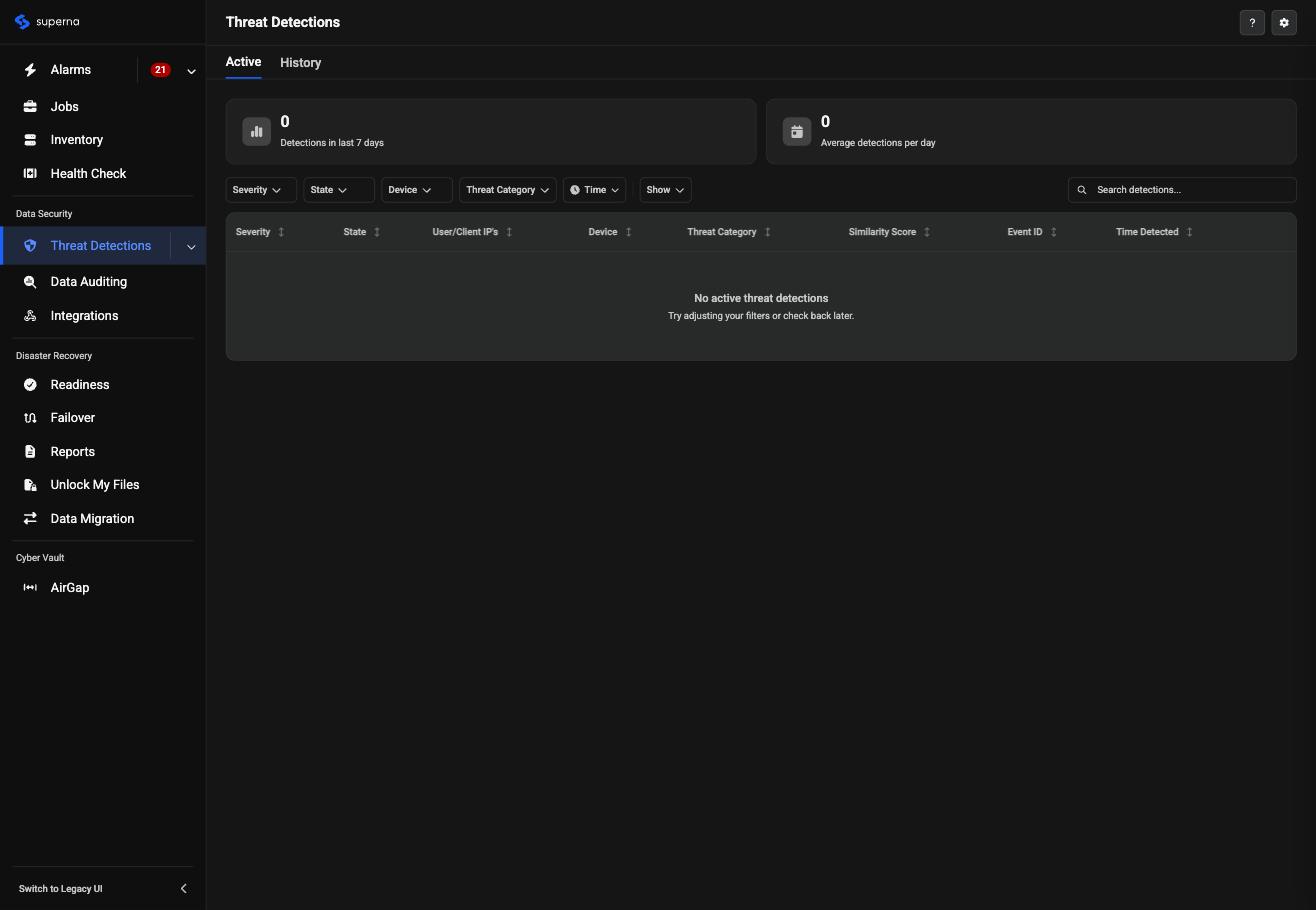
Threat Detections (left sidebar, under Data Security) replaces the legacy Ransomware Defender Alerts view. It lists security events raised by Ransomware Defender and Active Auditor side by side, with Active and History tabs.
Summary tiles at the top of the page show Detections in last 7 days, Average detections per day, and Audit log events processed. The event list itself shows, per row: Severity (Warning/Major/Critical), State (Monitor, Delayed Lockout, Lockout, and how long ago or until auto-close), User/Client IP, Device, and Threat Category.
Clicking a row opens the event detail panel on the right, which shows:
- The triggering threat categories, each with a plain-language description of the detected behavior.
- Signal Strength — a percentage breakdown of which detected behaviors contributed to the event's severity.
- Top Events — the most common file operations involved (Create, Delete, Rename, Other) with counts.
- Impacted Devices and Impacted Items counts.
- A Recovery Summary showing Recoverable vs. Unrecoverable item counts.
- Investigate & Recover and Take an Action buttons.
Take an Action opens the response menu (Restore User Access, Lockout Now, Stop the lockout timer, and the Close Event wizard, depending on event state). Investigate & Recover opens the dedicated investigation page — see below.
Ransomware Defender's Alerts view becoming Threat Detections is one of the more visually distinct changes in this release. Drag the slider below to compare the legacy and redesigned pages directly:
Drag the handle to compare — or use the arrow keys when focused.
Investigate & Recover
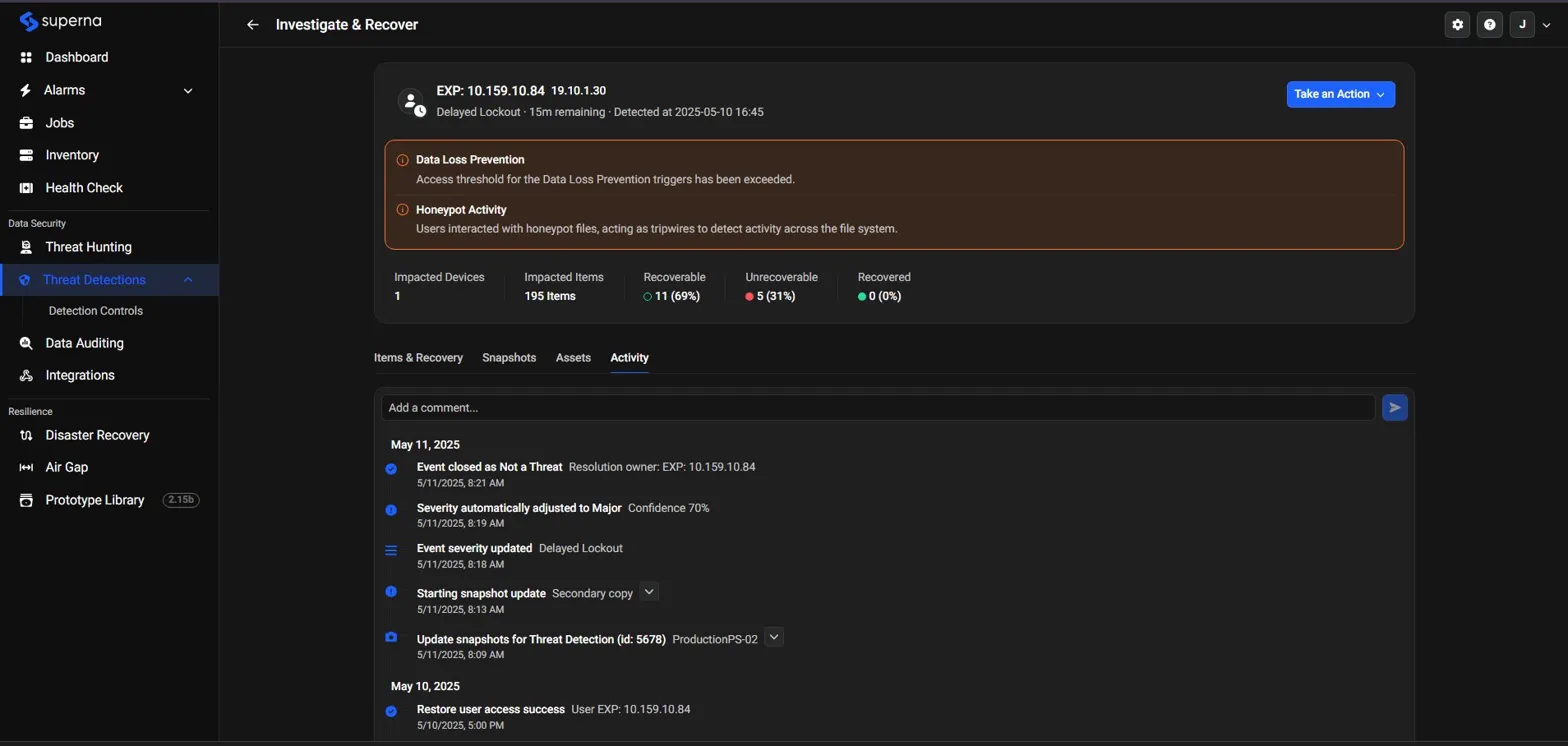
Investigate & Recover replaces the legacy Alert Overview page, whose Recovery Manager tab is now Items & Recovery. It's reached from an event's detail panel on the Threat Detections page (via the Investigate & Recover button) and presents four tabs: Items & Recovery, Snapshots, Assets, and Activity Log.
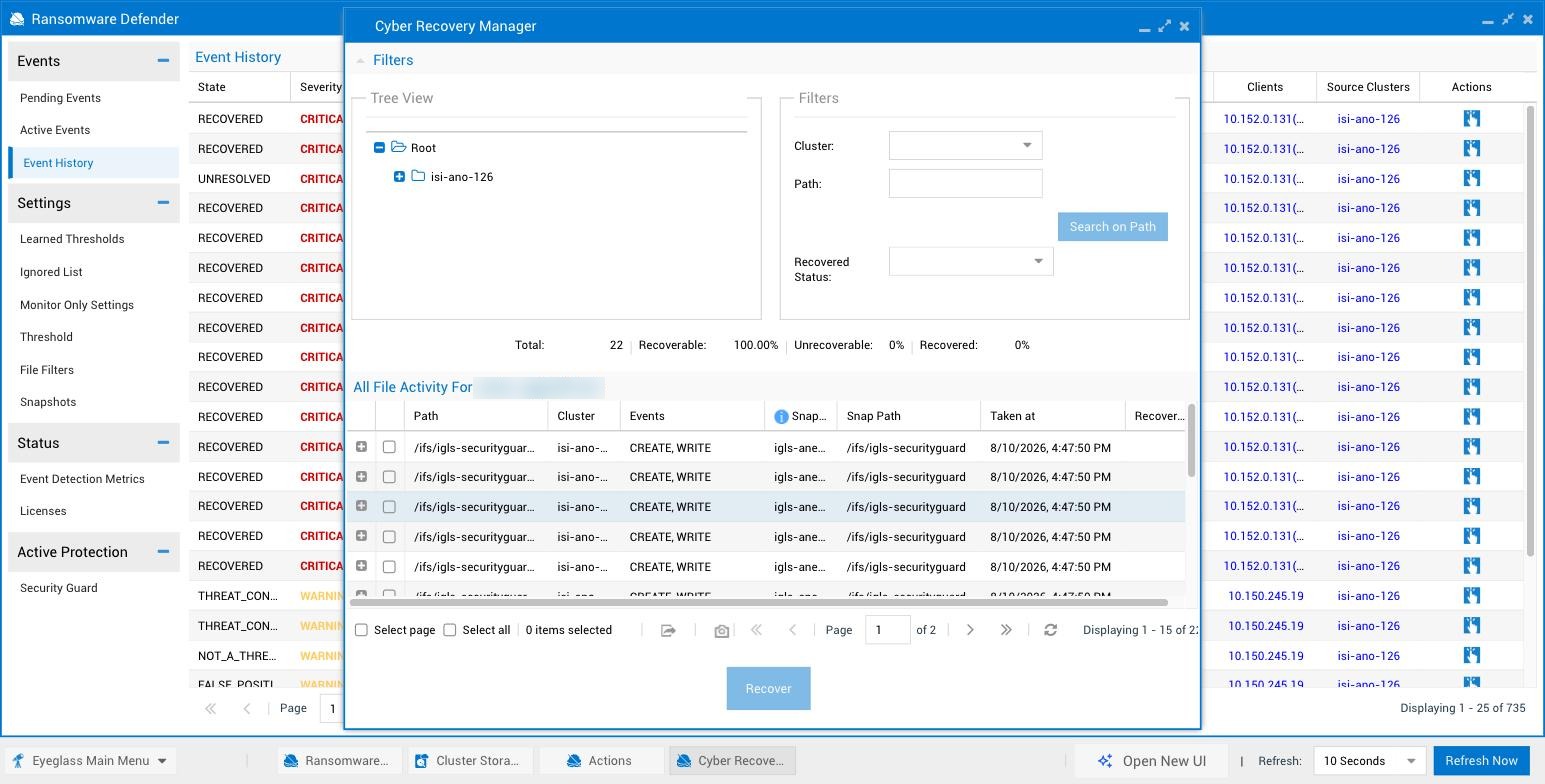
The page header repeats the event's key details and a live Take an Action button. Below it, summary counters show Impacted Devices, Impacted Items, Recoverable, Unrecoverable, and Recovered counts. Its closest legacy equivalent is the Ransomware Defender Cyber Recovery Manager dialog, reached via Event History → an event's Actions icon → Manage Event → Cyber Recovery Manager. The Activity Log tab on the new UI side has no single legacy equivalent screen — it's a synthesized audit trail rather than a direct one-to-one mapping — so the comparison below is closest at the recovery-summary level (Total/Recoverable/Unrecoverable/Recovered) rather than tab-for-tab. Drag the slider below to compare the legacy and redesigned pages:
Drag the handle to compare — or use the arrow keys when focused.
The screenshot above also shows Dashboard, Threat Hunting, and Prototype Library sidebar items. Threat Hunting is separately installed as part of Data Security Edition — see Navigation overview above for details. Dashboard and Prototype Library are not covered on this page.
Detection Controls
Detection Controls is a sub-item nested under Threat Detections in the sidebar. It replaces the legacy Ransomware Defender Settings screens and the Easy Auditor Active Auditing configuration, consolidating both into one tabbed page: Active Auditor, Learned Thresholds, Ignored List, Monitor Only, Suspicious Extensions, and Settings.
Active Auditor
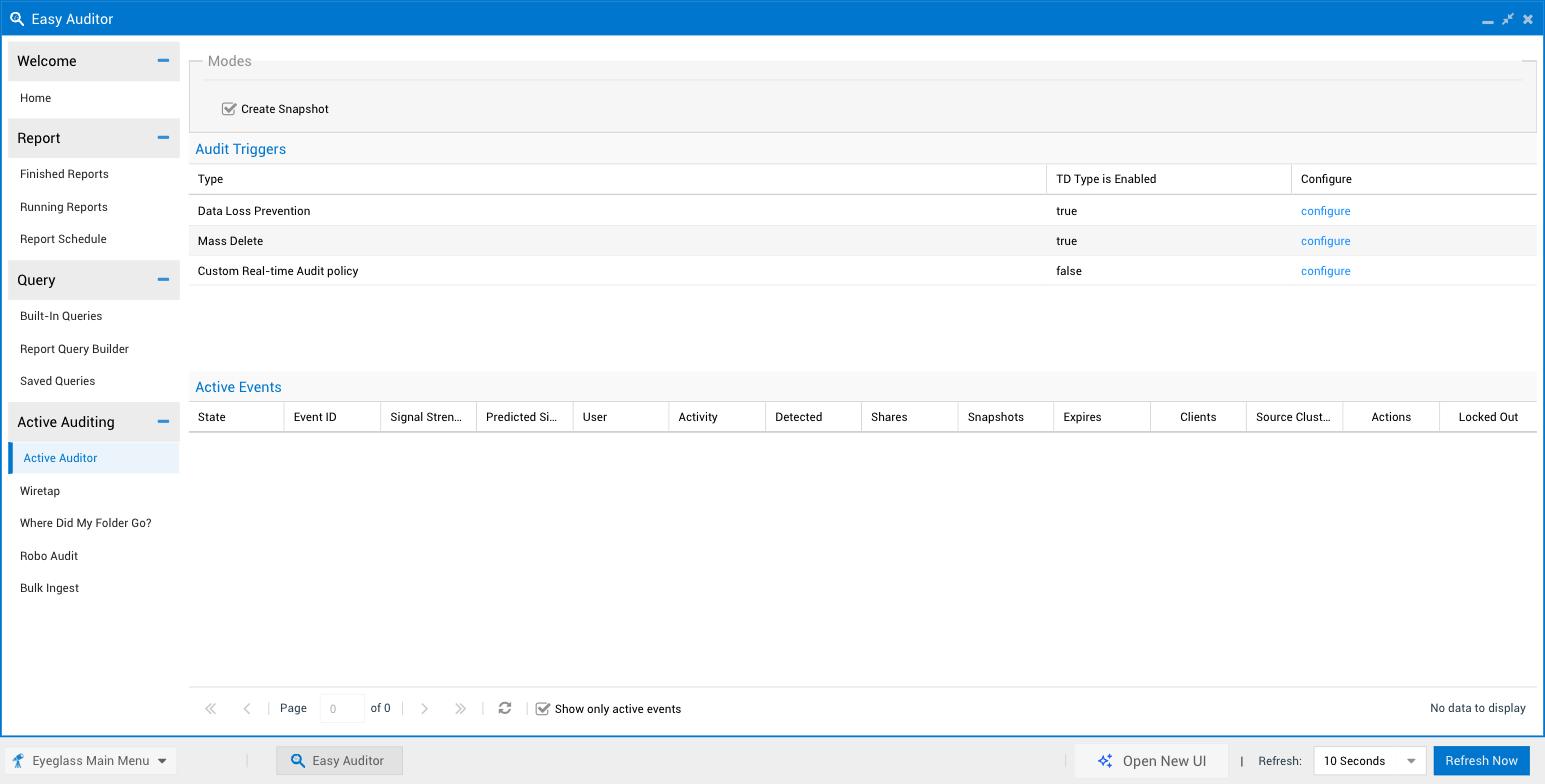
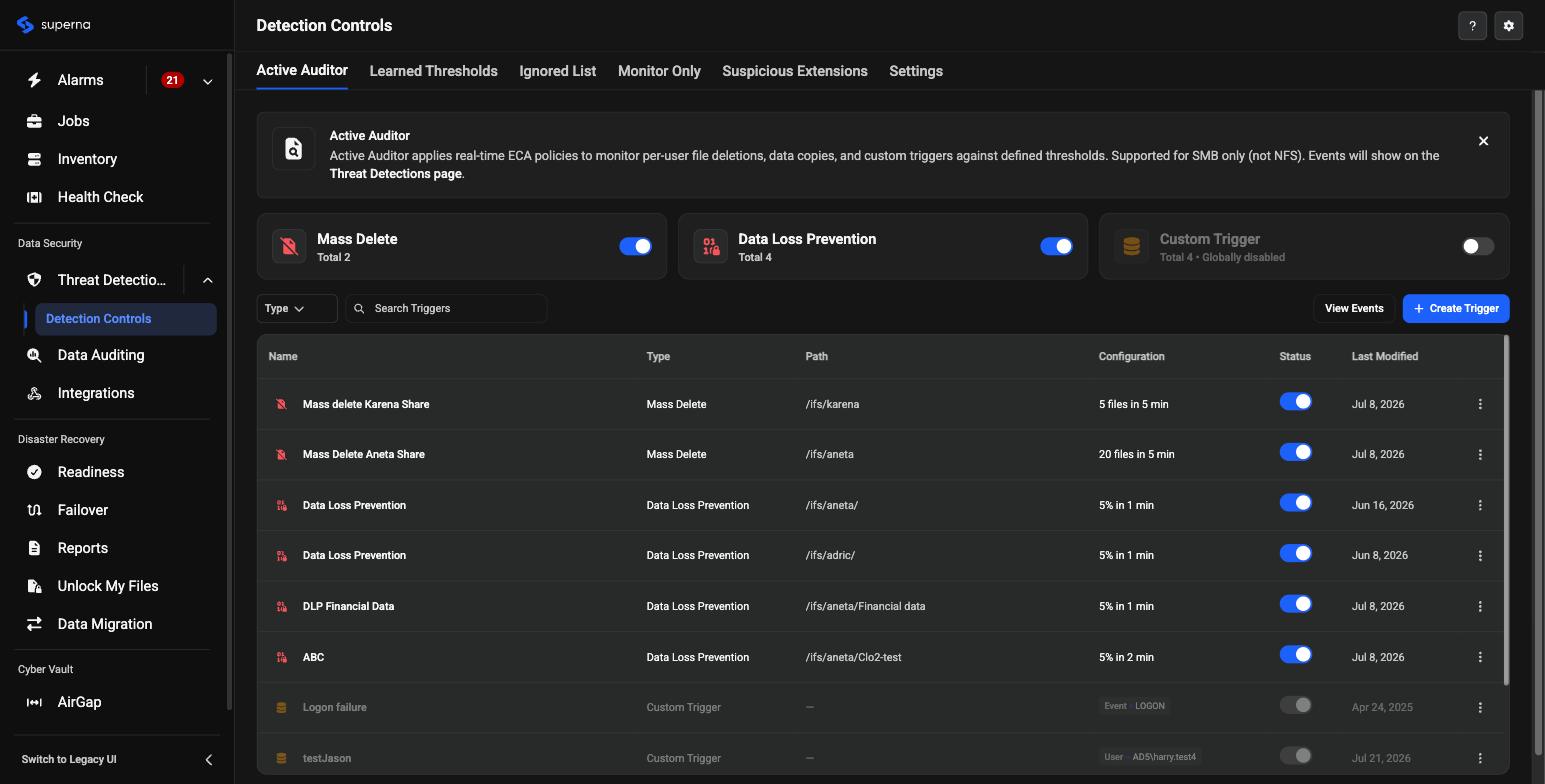
Active Auditor applies real-time ECA policies to monitor per-user file deletions, data copies, and custom triggers against defined thresholds. It is supported for SMB only (not NFS). Its closest legacy equivalent is the Easy Auditor icon's Active Auditing section. Drag the slider below to compare the legacy and redesigned pages:
Drag the handle to compare — or use the arrow keys when focused.
Each trigger row shows its type (Custom Trigger, Mass Delete, or Data Loss Prevention), monitored path, configuration (e.g., "5 files in 5 min" or "5% in 1 min"), and an enable/disable toggle.
Selecting + Create Trigger opens a guided panel for adding a new trigger.
Each trigger type description clarifies its purpose: all three are described as helping the system "learn and suppress similar alerts," positioning them primarily as false-positive reduction tools tuned to your environment, in addition to their detection role. Trigger creation is Choose Trigger, then configure it — some trigger types require an additional advanced-configuration step; for example, defining audit criteria and interval/threshold rules is mandatory for Custom Trigger (see Create or Edit a Custom Real-time Audit Policy).
Active Auditor now supports integration with Cyber Recovery Manager. See Threat Detection and Severity Settings — Active Auditor and Detection Controls and False Positive Management for details.
Learned Thresholds
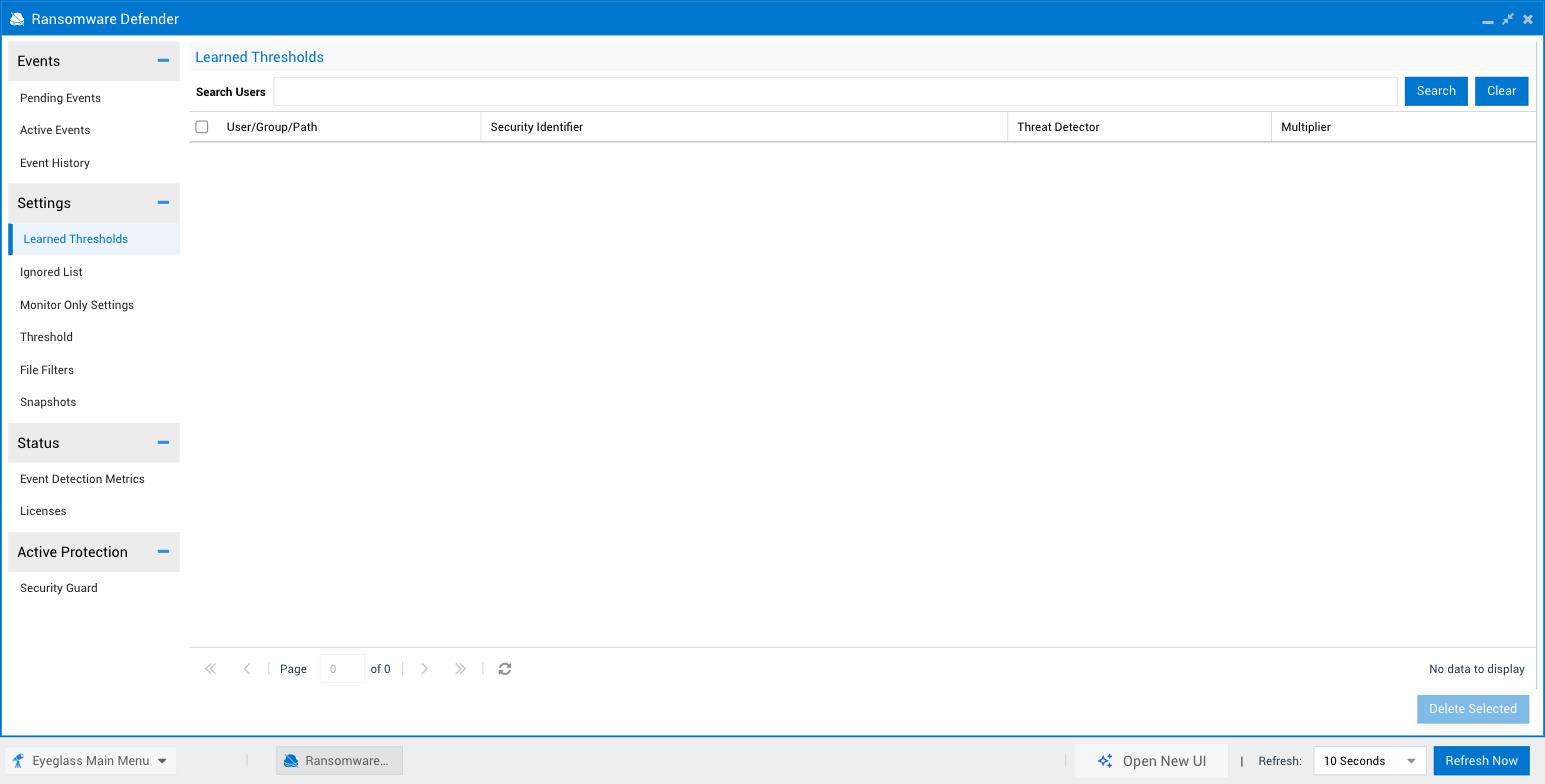
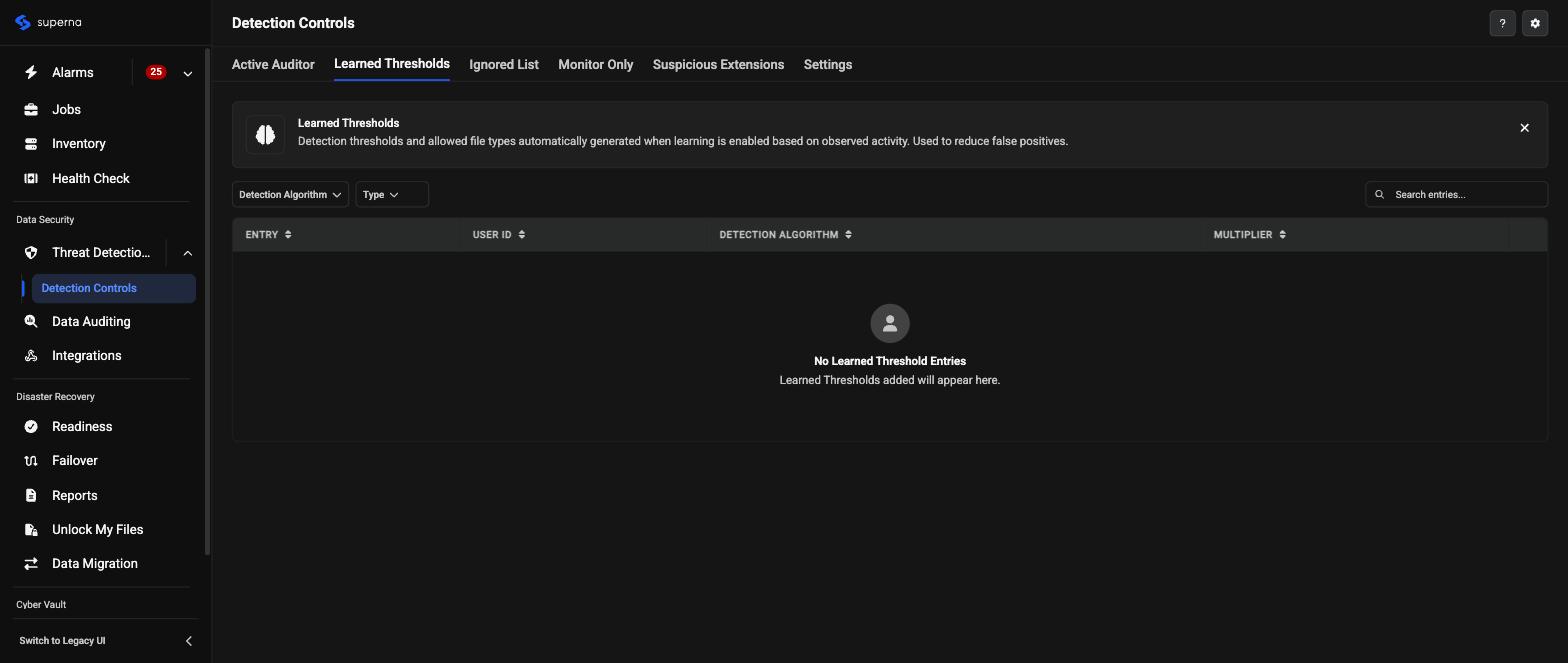
The Learned Thresholds tab lists thresholds the system has learned per path, per user, or per user group, based on observed activity. This tab replaces the legacy Ransomware Defender Settings → Learned Thresholds screen. Drag the slider below to compare the legacy and redesigned pages:
Drag the handle to compare — or use the arrow keys when focused.
Ignored List and Monitor Only
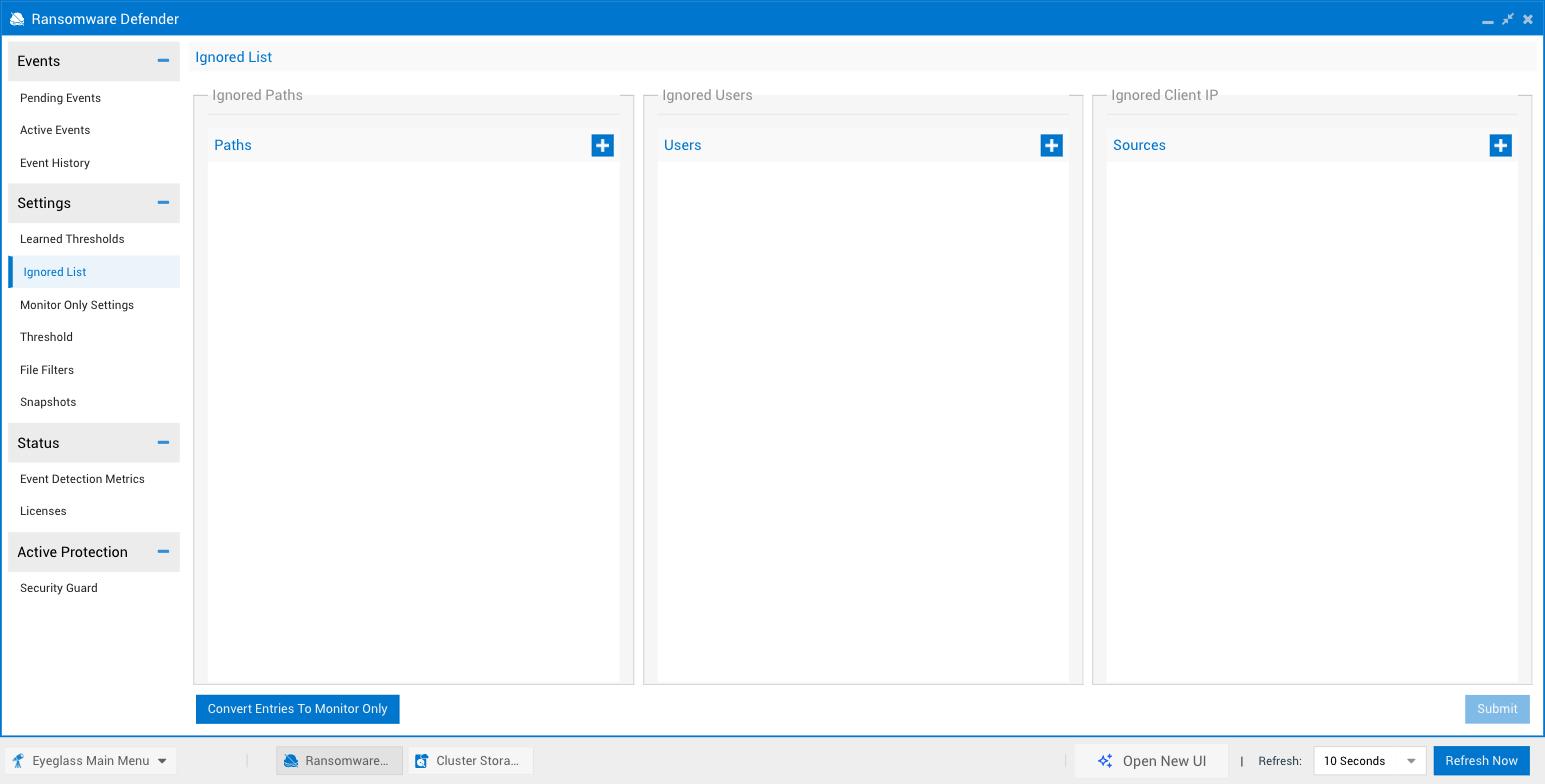
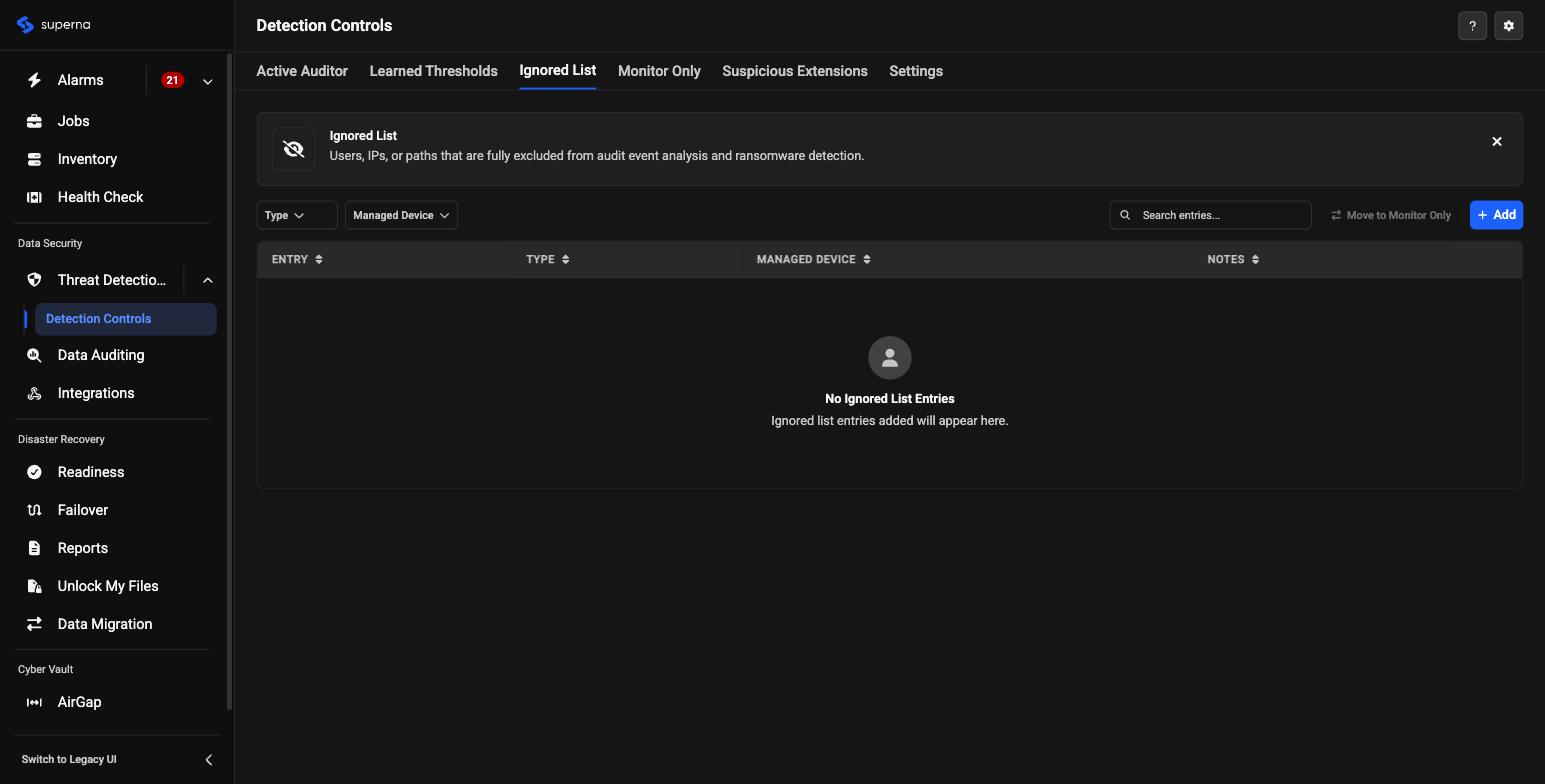
The Ignored List tab configures paths, users, and sources to exclude entirely from ransomware detection. Monitor Only (a separate tab, not pictured) configures entries that are still tracked but excluded from automated lockout — the recommended approach for accounts such as IAM users on ECS, which cannot use Learned Thresholds. This tab replaces the legacy Ransomware Defender Settings → Ignored List screen. Drag the slider below to compare the legacy and redesigned pages:
Drag the handle to compare — or use the arrow keys when focused.
Suspicious Extensions
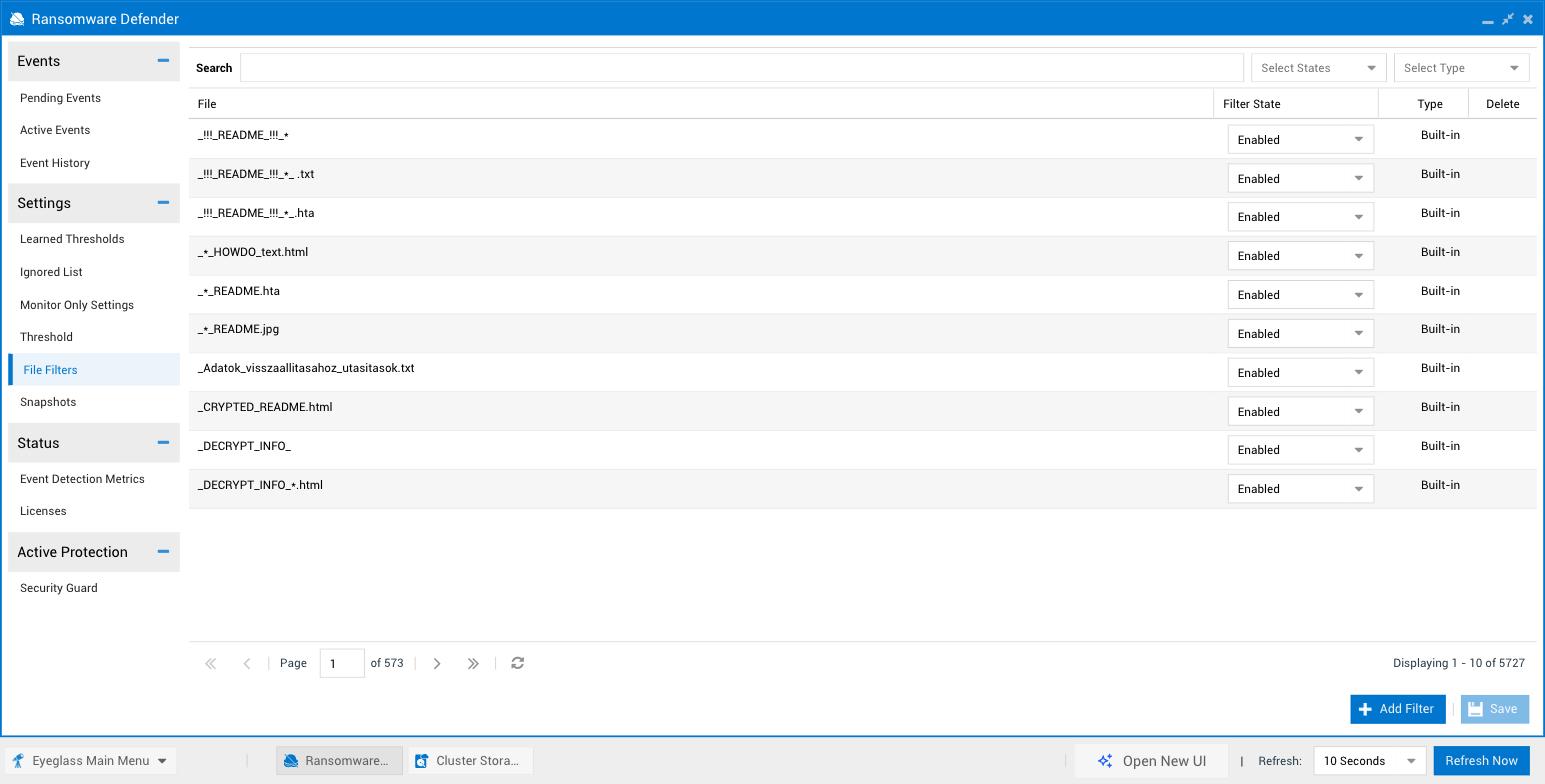
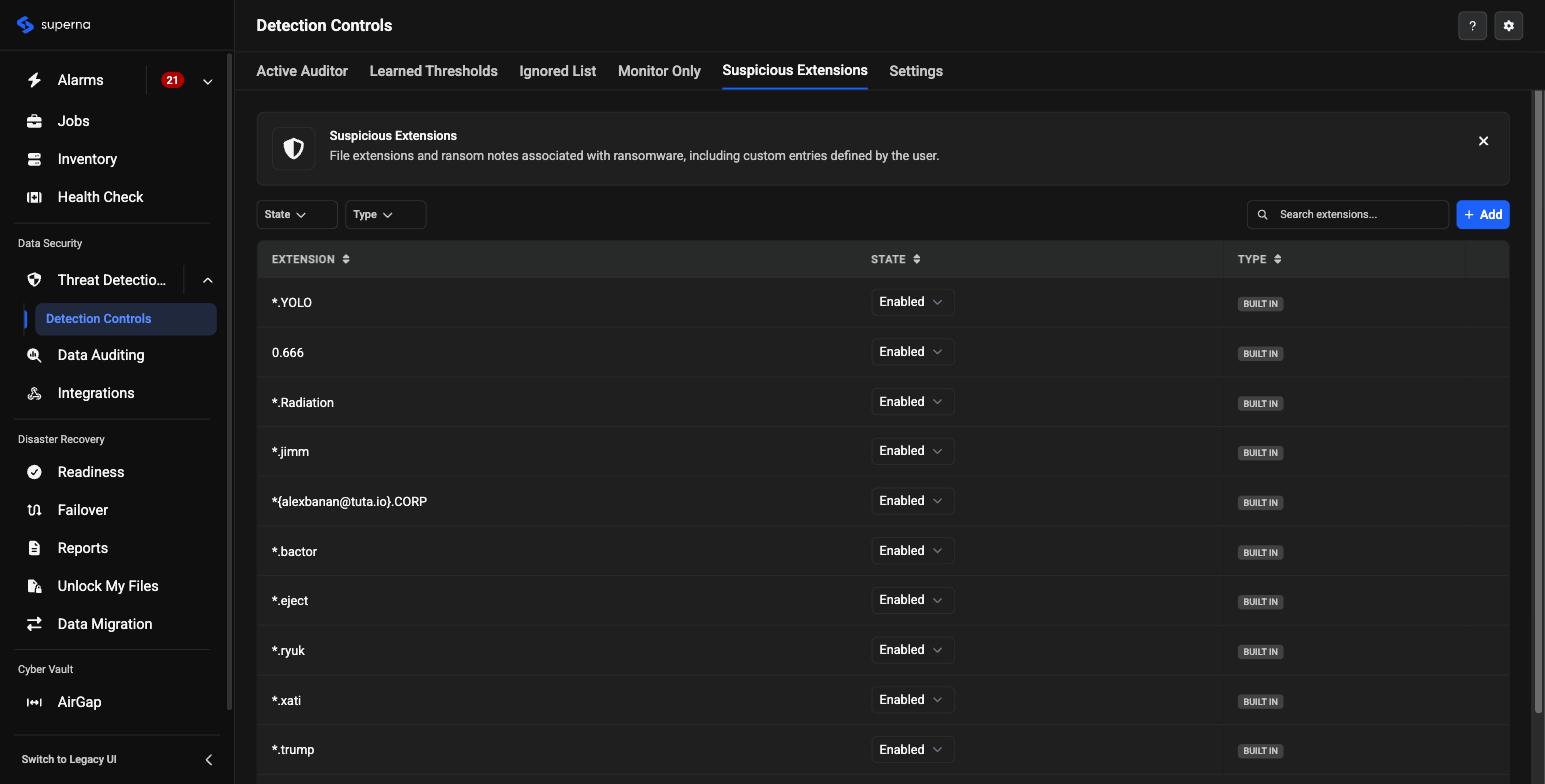
This tab replaces the legacy Ransomware Defender File Filters screen. It lists the file extensions monitored for ransomware detection, each independently enabled or disabled, with a Last Updated timestamp and an Add button for new entries. Drag the slider below to compare the legacy and redesigned pages:
Drag the handle to compare — or use the arrow keys when focused.
Detection Controls Settings
The Settings tab is Detection Controls' own settings screen — scoped to ransomware detection and response tuning, not to be confused with the platform-level Settings page (gear icon, top-right of any page), which is covered separately under Settings below. This tab consolidates what used to be several separate legacy Ransomware Defender screens into one page. Rather than a single scrolling screen, it is broken out below into its four constituent sections, each compared against its closest legacy equivalent.
Response Settings
Response Settings covers the Lockout Behavior & Learning selector (Monitor, Enforcement, Critical) and Event Severities, matching the modes described in Threat Response, Lockout and Snapshots. An Auto-Learn From Events toggle controls whether unreviewed events are automatically added to Learned Thresholds. Its closest legacy equivalent is the top of the Ransomware Defender Settings → Threshold screen:
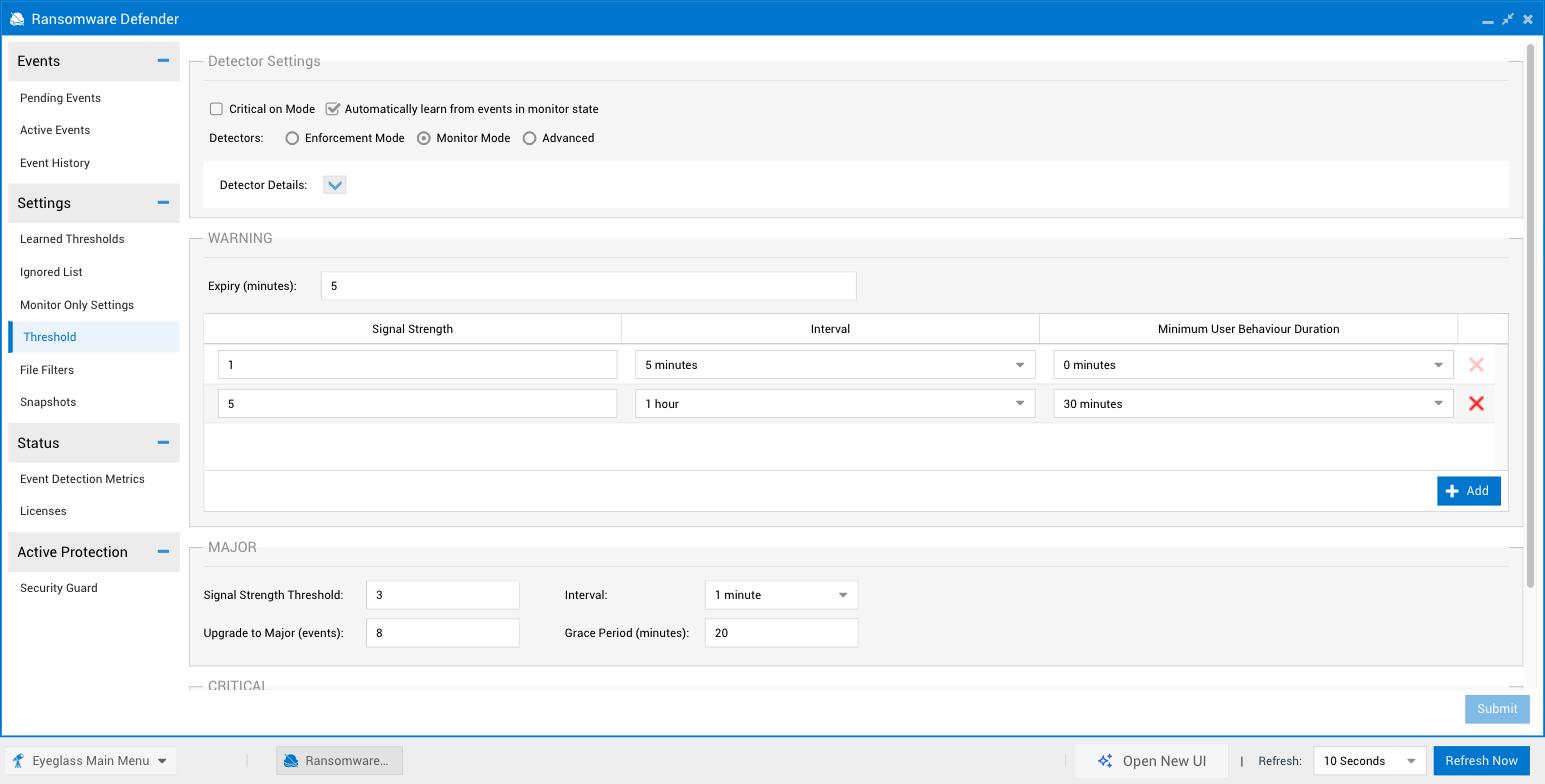
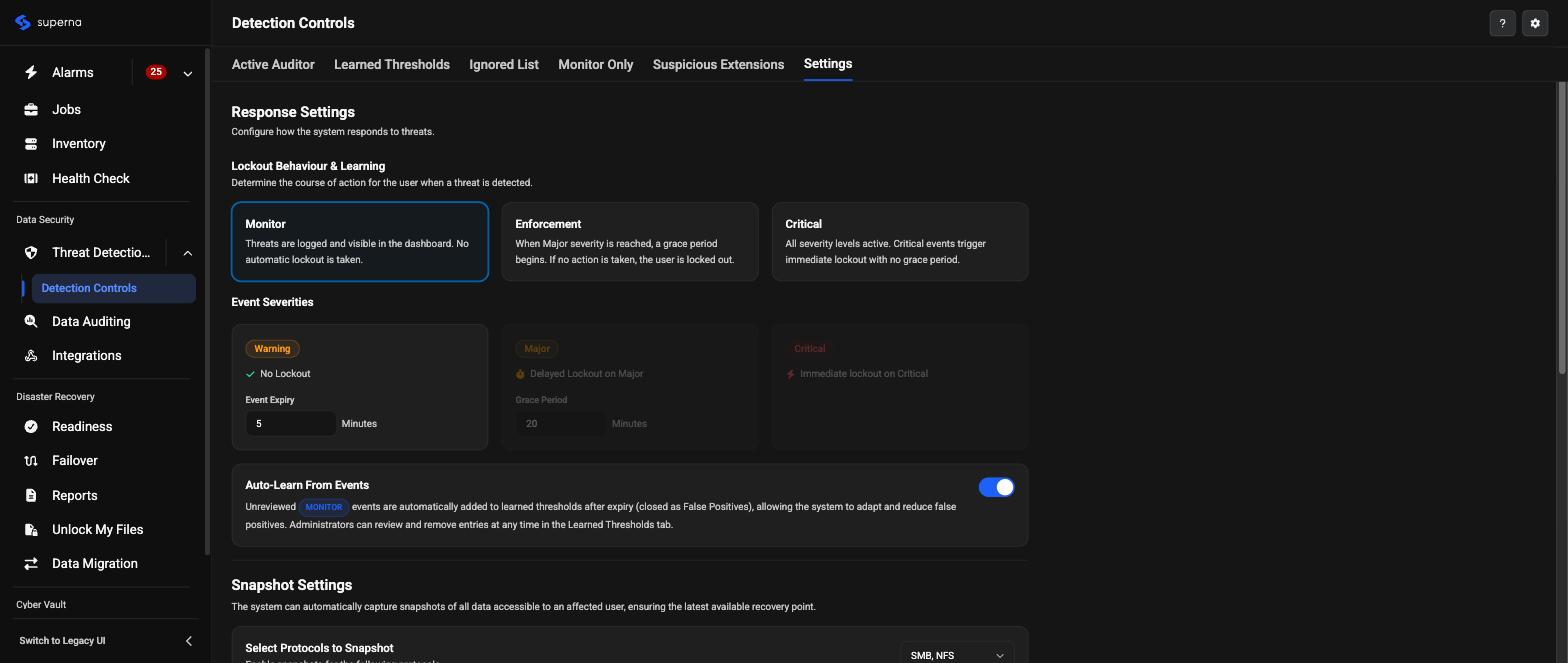
Drag the handle to compare — or use the arrow keys when focused.
Snapshot Settings
Snapshot Settings covers protocol selection (SMB/NFS), Snapshot Quota, Hours Until Expiry, and the Take Snapshots for Critical Paths Only toggle. See Snapshot Settings. Its closest legacy equivalent is the Ransomware Defender Settings → Snapshots screen:
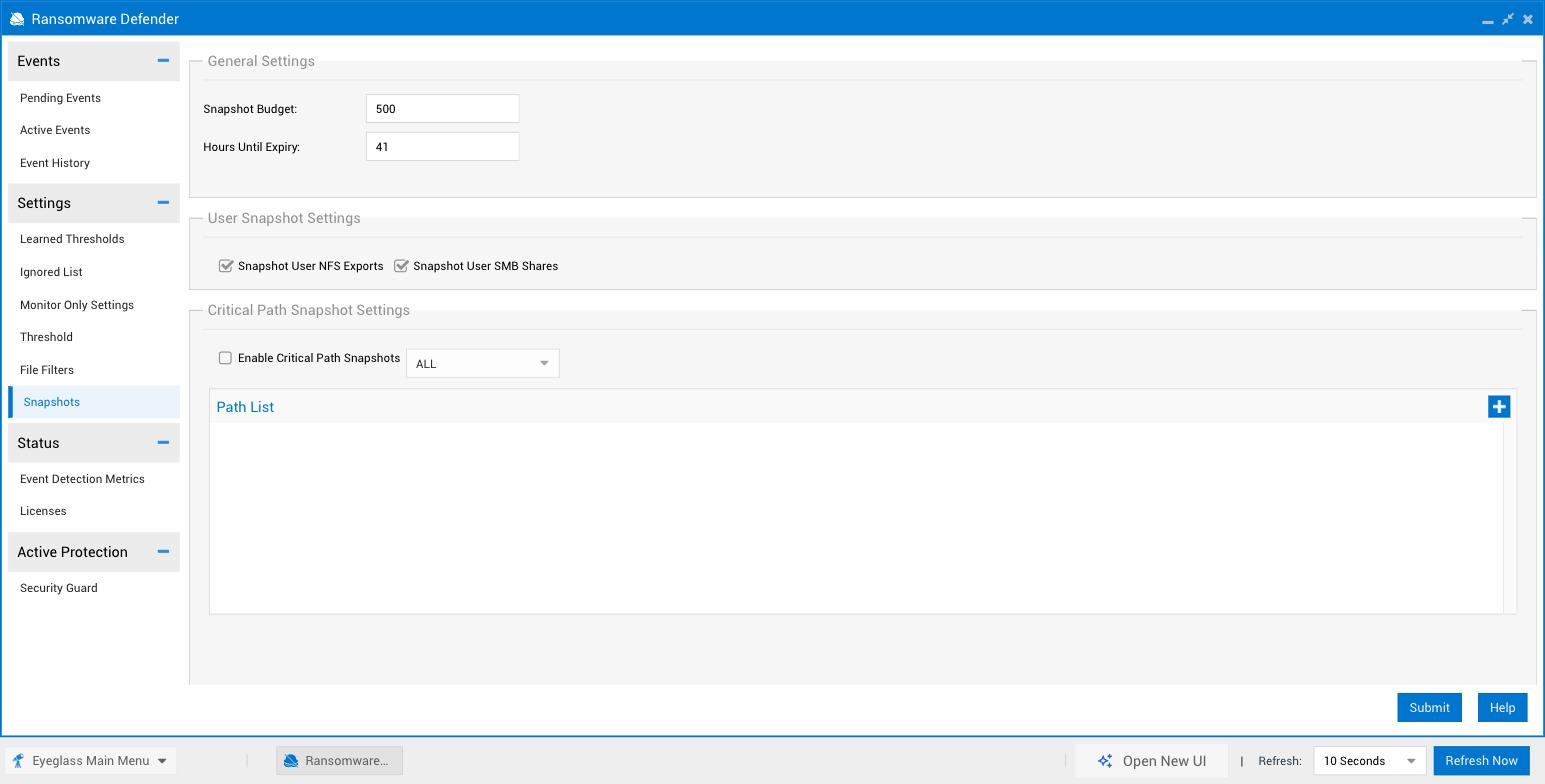
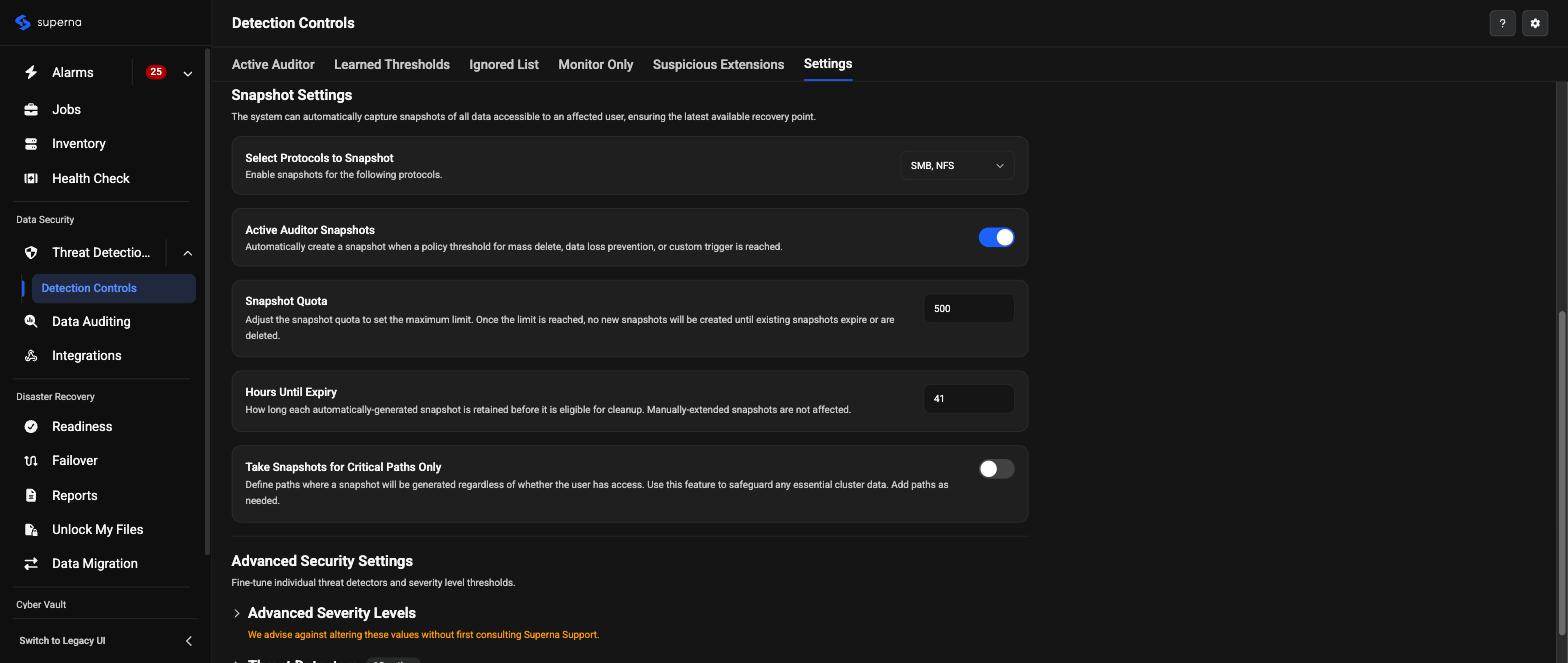
Drag the handle to compare — or use the arrow keys when focused.
Advanced Severity Levels
Advanced Severity Levels covers per-severity Signal Strength tuning (Single Vector / Dual Vector values for Warning, Major, and Critical), Minimum User Behavior Duration, and Upgrade event thresholds. Its closest legacy equivalent is the Warning/Major/Critical severity rows of the Ransomware Defender Settings → Threshold screen:
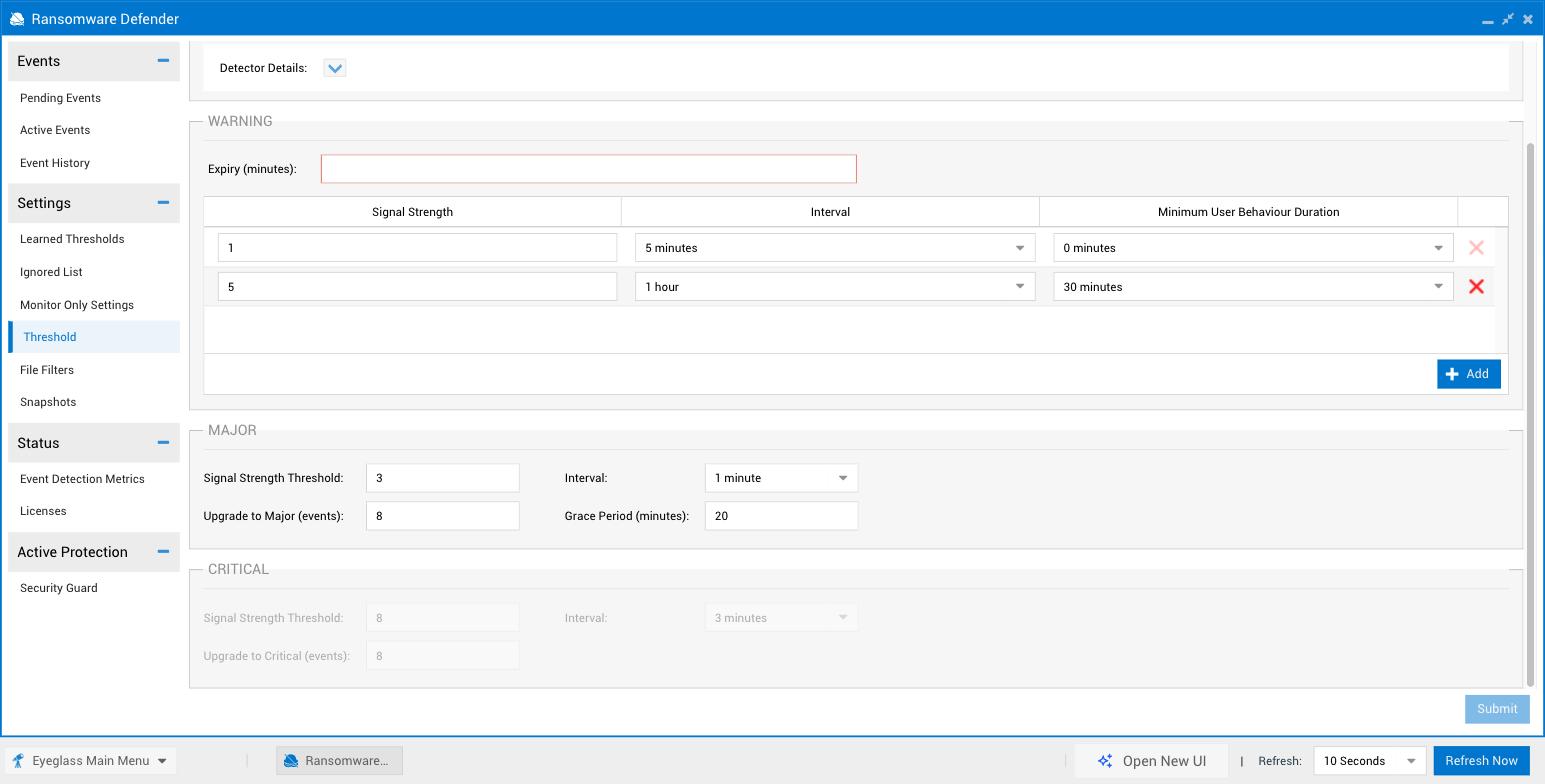
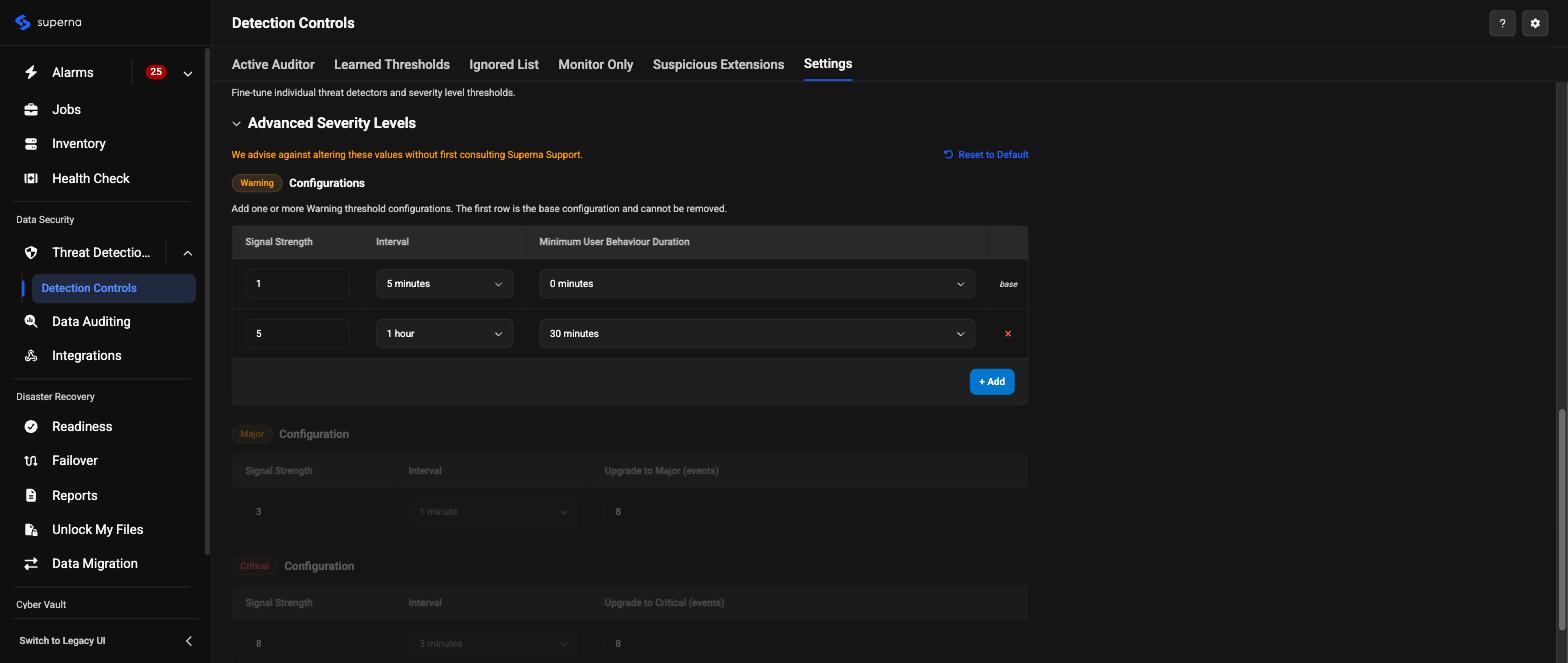
Drag the handle to compare — or use the arrow keys when focused.
Threat Detectors
Threat Detectors lists the full set of individually toggleable detection types (Data Creation and Deletion, Data Encryption, Data Renaming, Simulated Attack, Suspicious Extension, Mass Delete, Data Loss Prevention, Honeypot Activity, Data Overwrite, Multi-Extension File Modification, and their ECS-specific counterparts). Its closest legacy equivalent is the expanded Detector Details table on the Ransomware Defender Settings → Threshold screen:
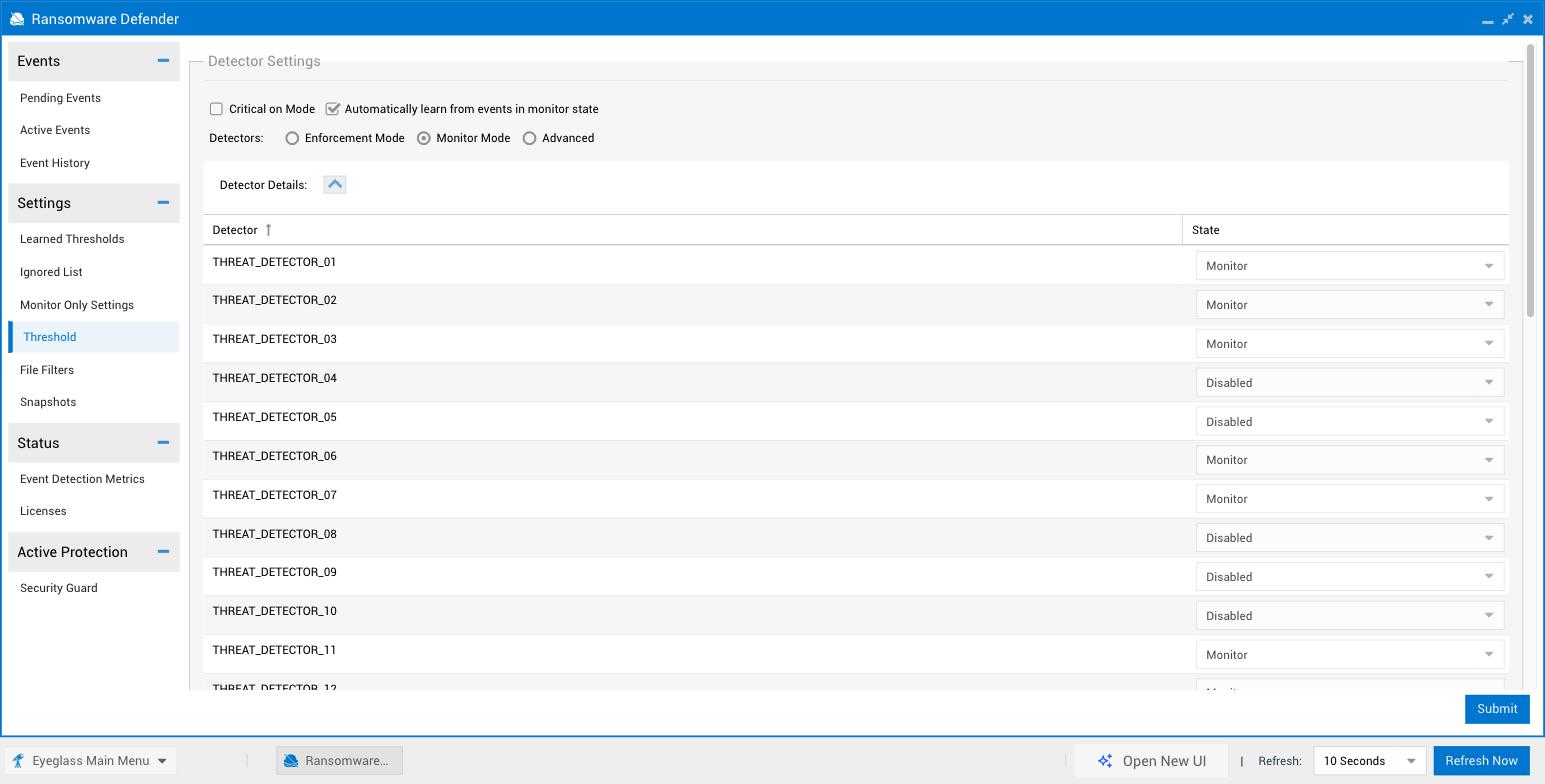
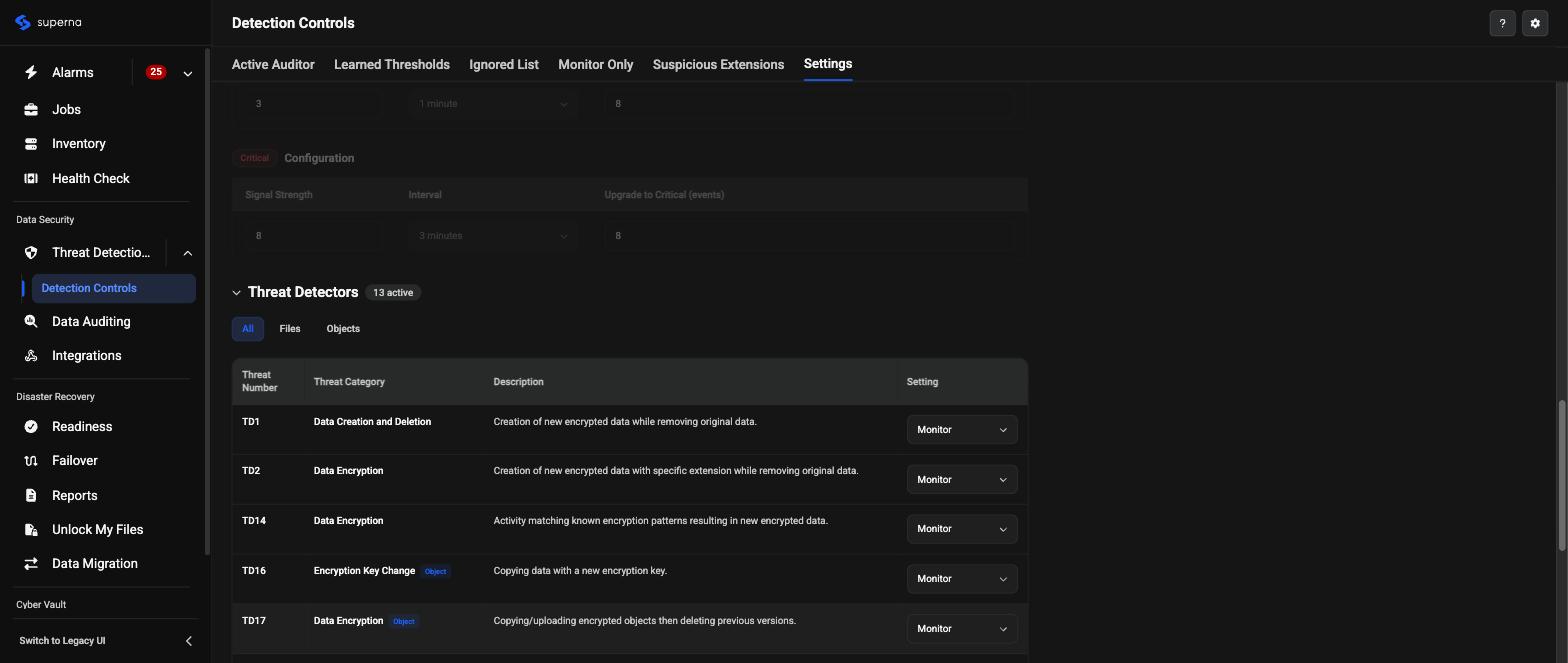
Drag the handle to compare — or use the arrow keys when focused.
Data Auditing
Data Auditing (left sidebar, under Data Security) replaces the legacy Easy Auditor Queries and Reports, Wiretap, and Bulk Ingest functions, consolidating them into one page with four tabs: Queries & Reports, Where Did My Folder Go?, WireTap, and Bulk Ingest.
Queries & Reports shows a query builder panel on the left (Built-in Queries and Custom Queries, with a + Create Query button) and the report run history on the right, with per-report status (Queued, Running, Success, Failed, Canceled), run type (Scheduled/Manual), record counts, and duration.
The legacy Easy Auditor home screen is a single navigation hub for Report, Query, and Active Auditing functions rather than a dedicated Queries & Reports screen, so it's the closest available legacy equivalent for the comparison below. Drag the slider below to compare the legacy Easy Auditor home screen with the redesigned Data Auditing page:
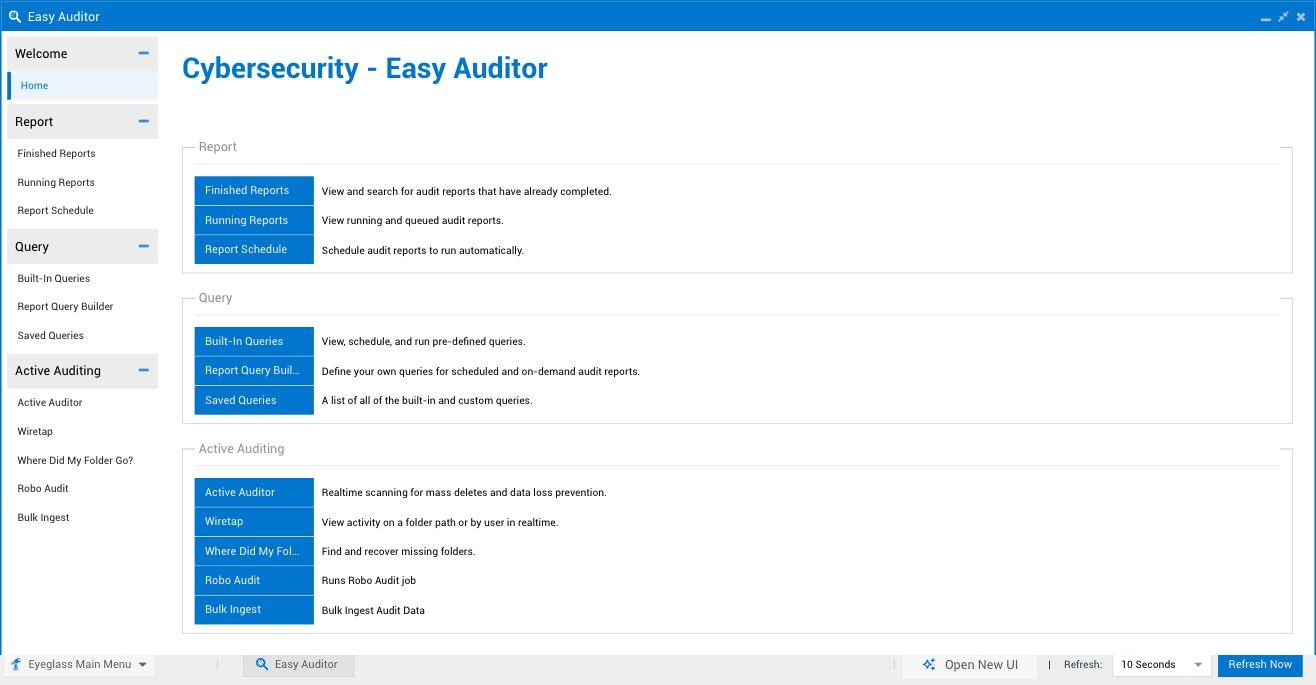
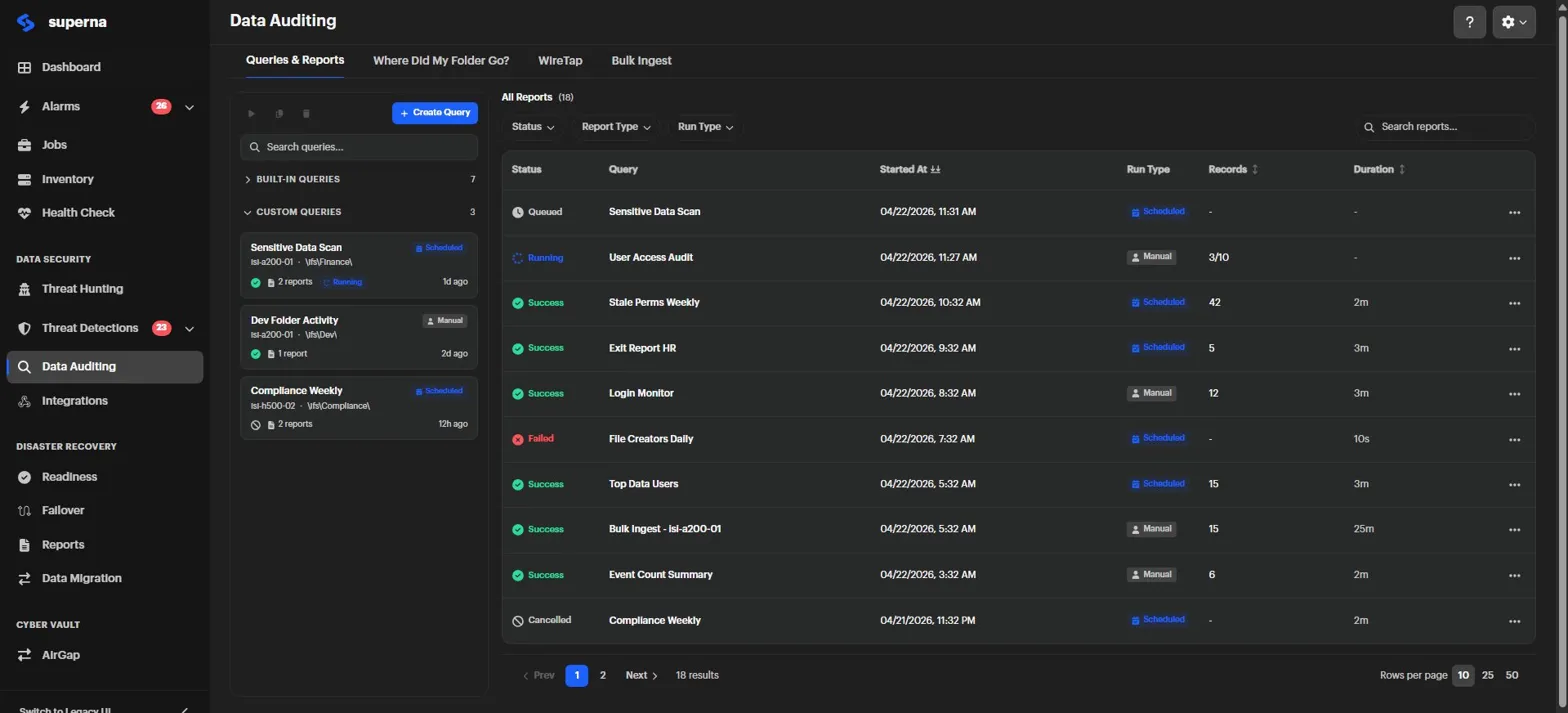
Drag the handle to compare — or use the arrow keys when focused.
Bulk Ingest lets you load historical or backup audit logs for a selected cluster and a single target date, for scenarios where audit data needs to be reprocessed outside the normal real-time ingestion path. It replaces the legacy Easy Auditor Bulk Ingest screen. Drag the slider below to compare the legacy and redesigned pages:
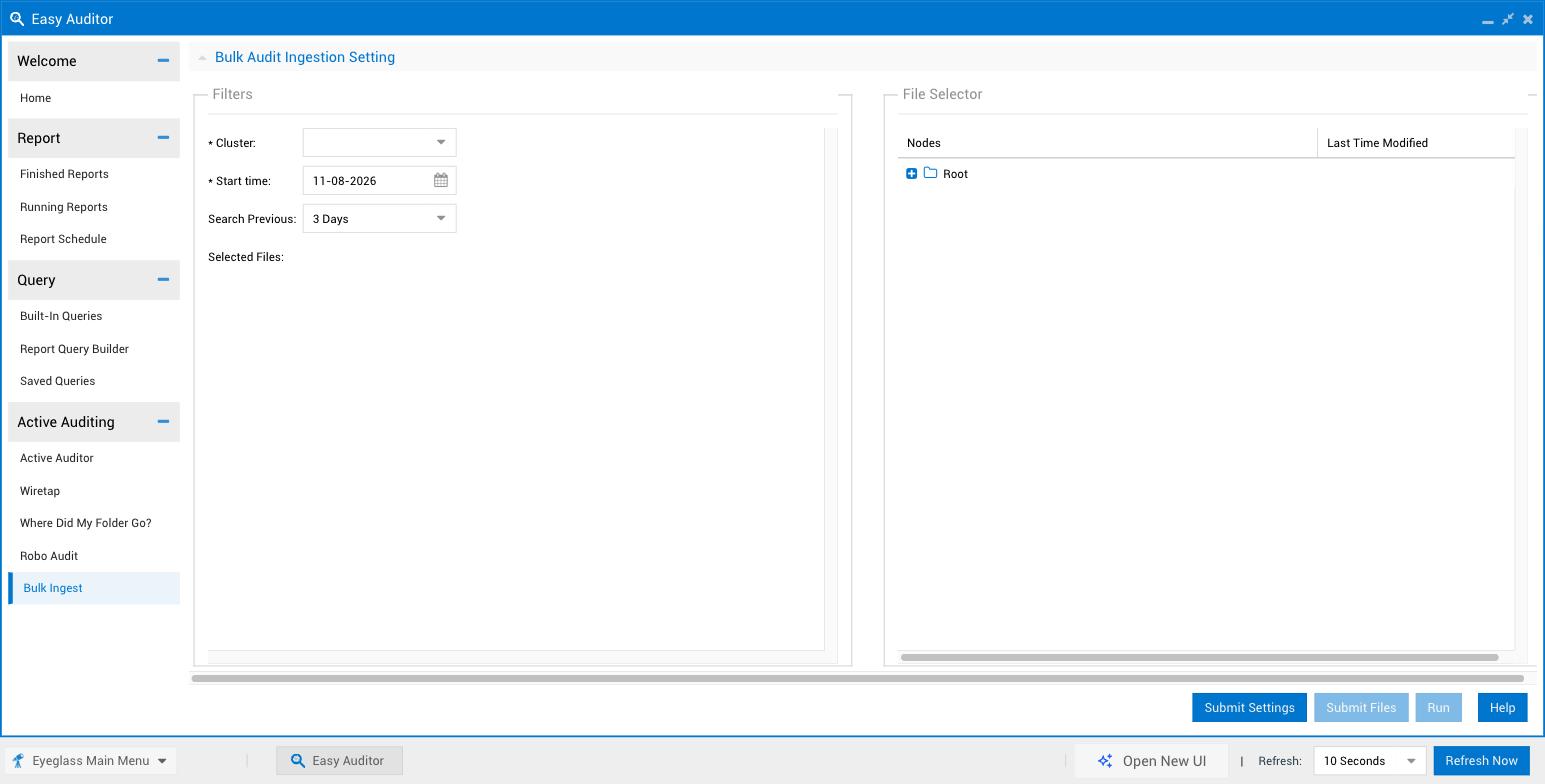
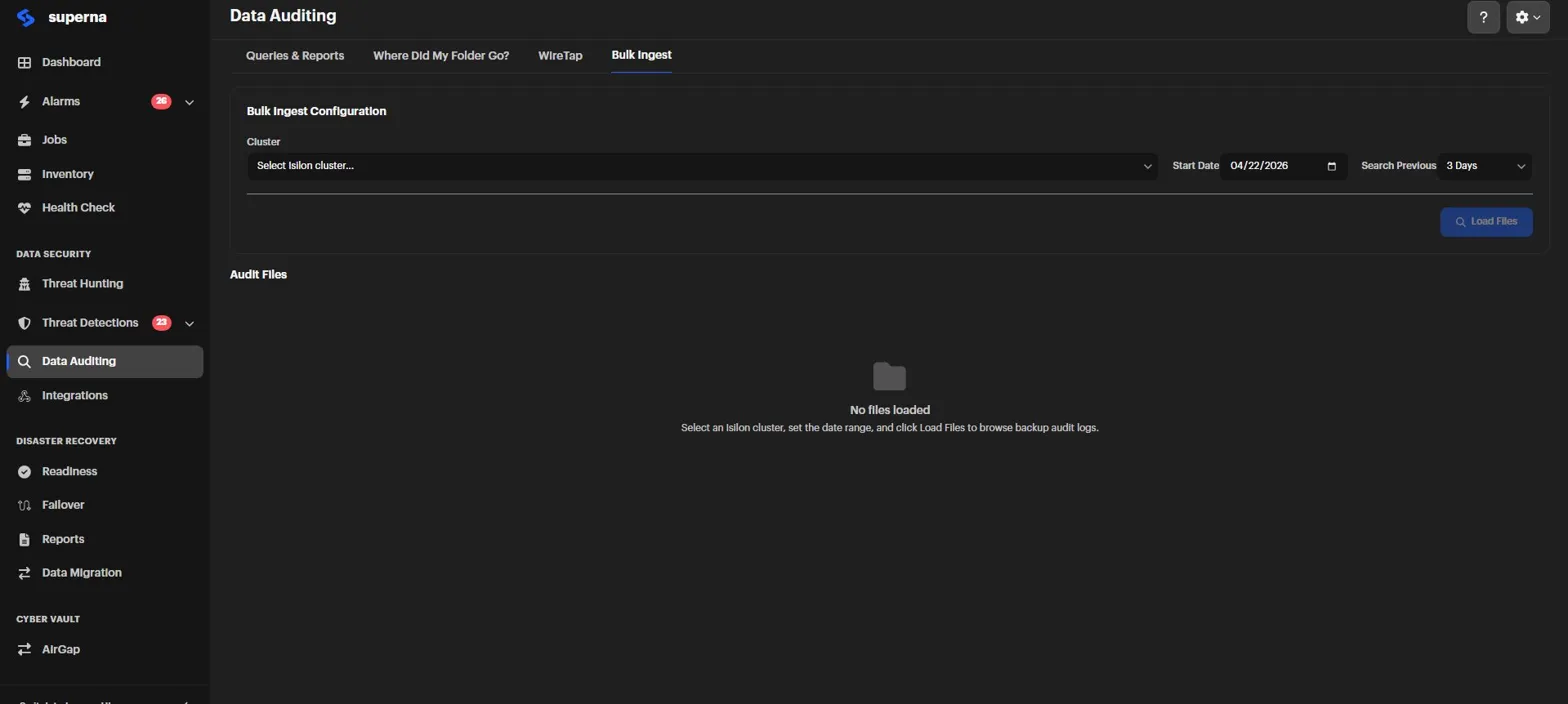
Drag the handle to compare — or use the arrow keys when focused.
Integrations
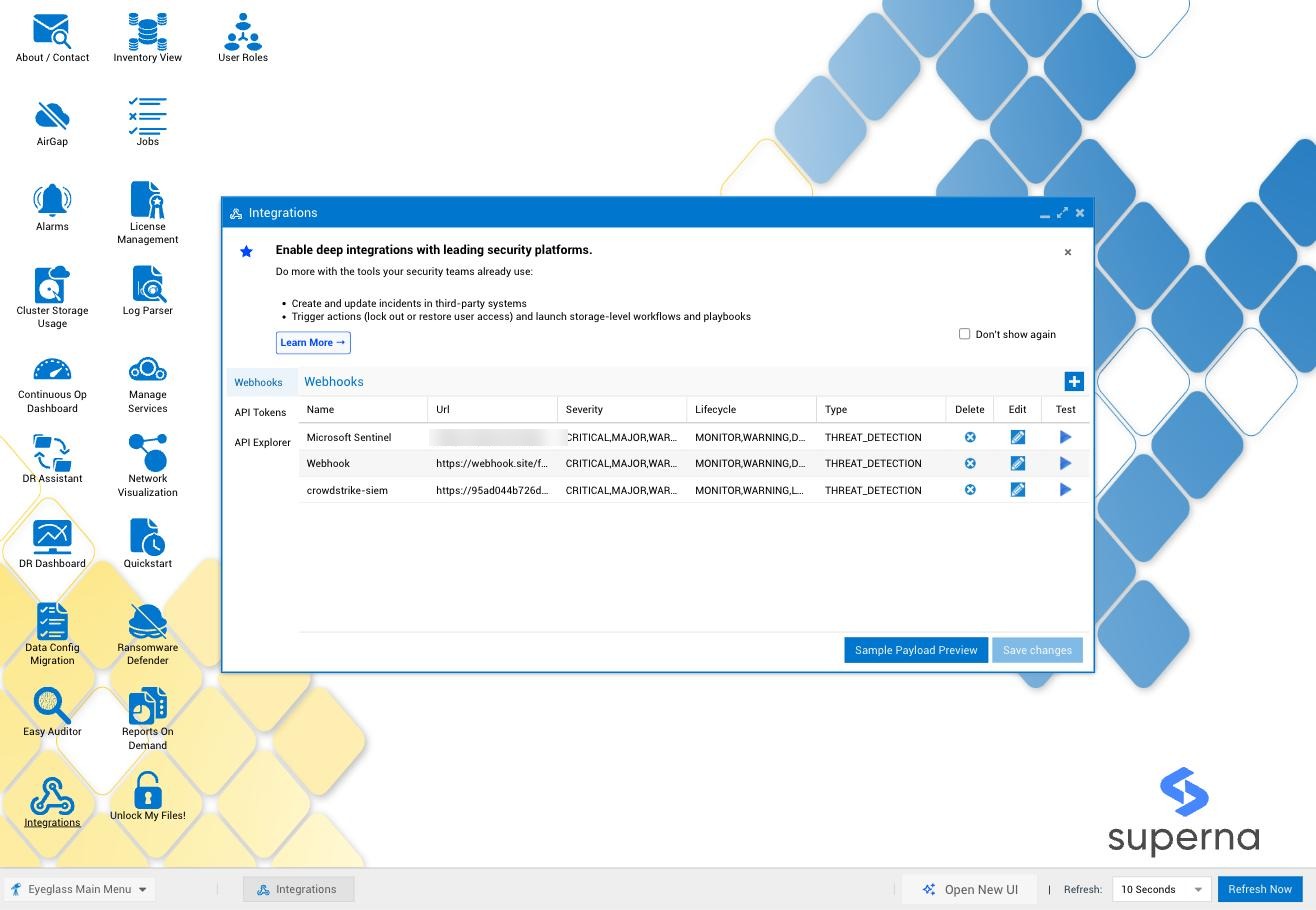
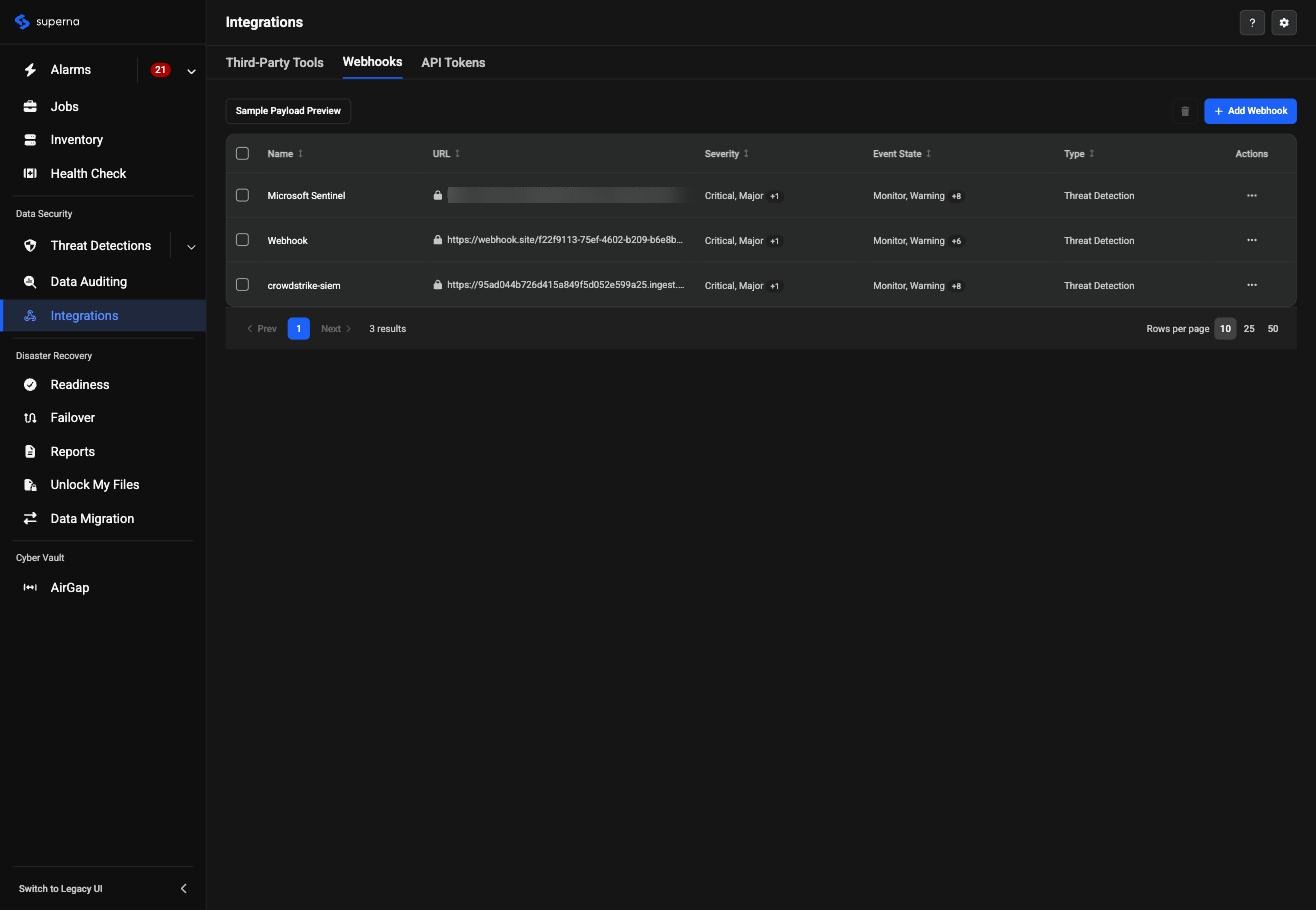
Integrations (left sidebar, under Data Security) replaces the legacy Integrations icon's Webhooks, API Tokens, and API Explorer tabs. The 2.15.0 page has three tabs: Third-Party Tools (new in 2.15.0, no legacy equivalent), Webhooks, and API Tokens. API Explorer is not a separate tab in 2.15.0 — it's a link in the API Tokens tab's header.
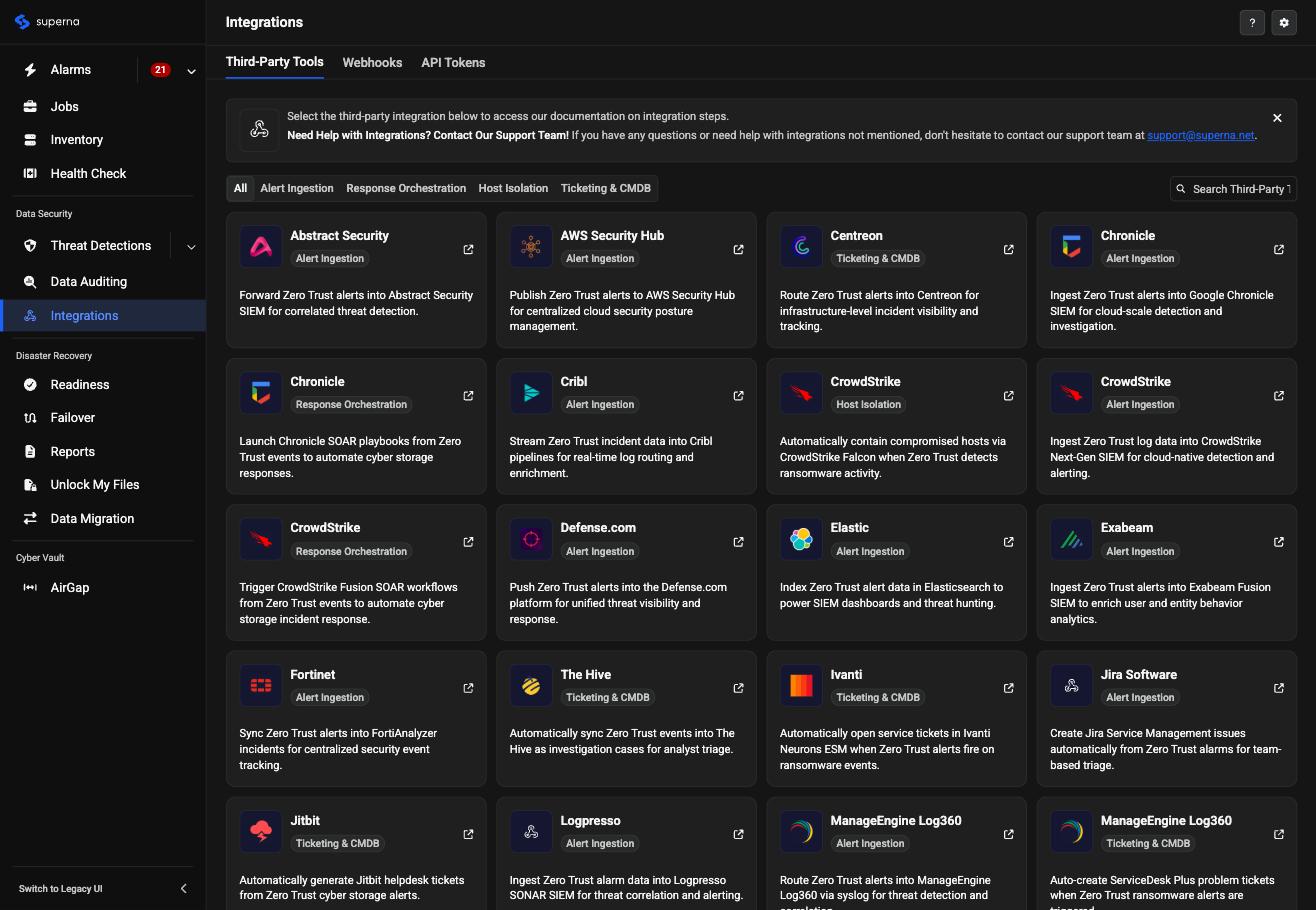
Third-Party Tools is a browsable, filterable catalog (filters: All, Alert Ingestion, Response Orchestration, Host Isolation, Ticketing & CMDB) of supported third-party platforms, each with a short description and a link out to the relevant setup documentation. This tab is new in 2.15.0 and has no legacy equivalent, so there's no old-UI side to compare it against.
Webhooks — the same view Integrations opened to in the legacy UI — lists configured webhook endpoints with their name, URL, severity filter, event state filter, and type, plus a Sample Payload Preview and per-row Edit/Delete/Test actions. API Tokens carries over unchanged in function from the legacy UI, with API Explorer now reached via a link in its header rather than as its own tab. Drag the slider below to compare the legacy Integrations window with the redesigned Webhooks tab:
Drag the handle to compare — or use the arrow keys when focused.
Health Check
Health Check (shared, top of sidebar) is where scheduled self-tests and diagnostic tools live. The Overview tab shows a summary card per tool — Security Guard and Robo Audit (pass rate over the last 10 runs, last-run timestamp, schedule, and a Run Now button) and Runbook Robot (run count or a "no runs" state — a Disaster Recovery feature) — plus a Runs calendar heatmap and per-tool run/pass/fail counters for the year. The Manage Services tab lists one row per ECA node plus Eyeglass itself, in a Virtual Machine/IP:Port/Eyeglass Token/Service Type table with a Last check-in timestamp; ECA Health Check and ECA Monitor are the two views toggled above that table, not rows within it — ECA Monitor opens a Grafana dashboard of event rate per ECA. See Health Check for the full tab-by-tab walkthrough, including Runs, Log Parser, and Settings.
Settings
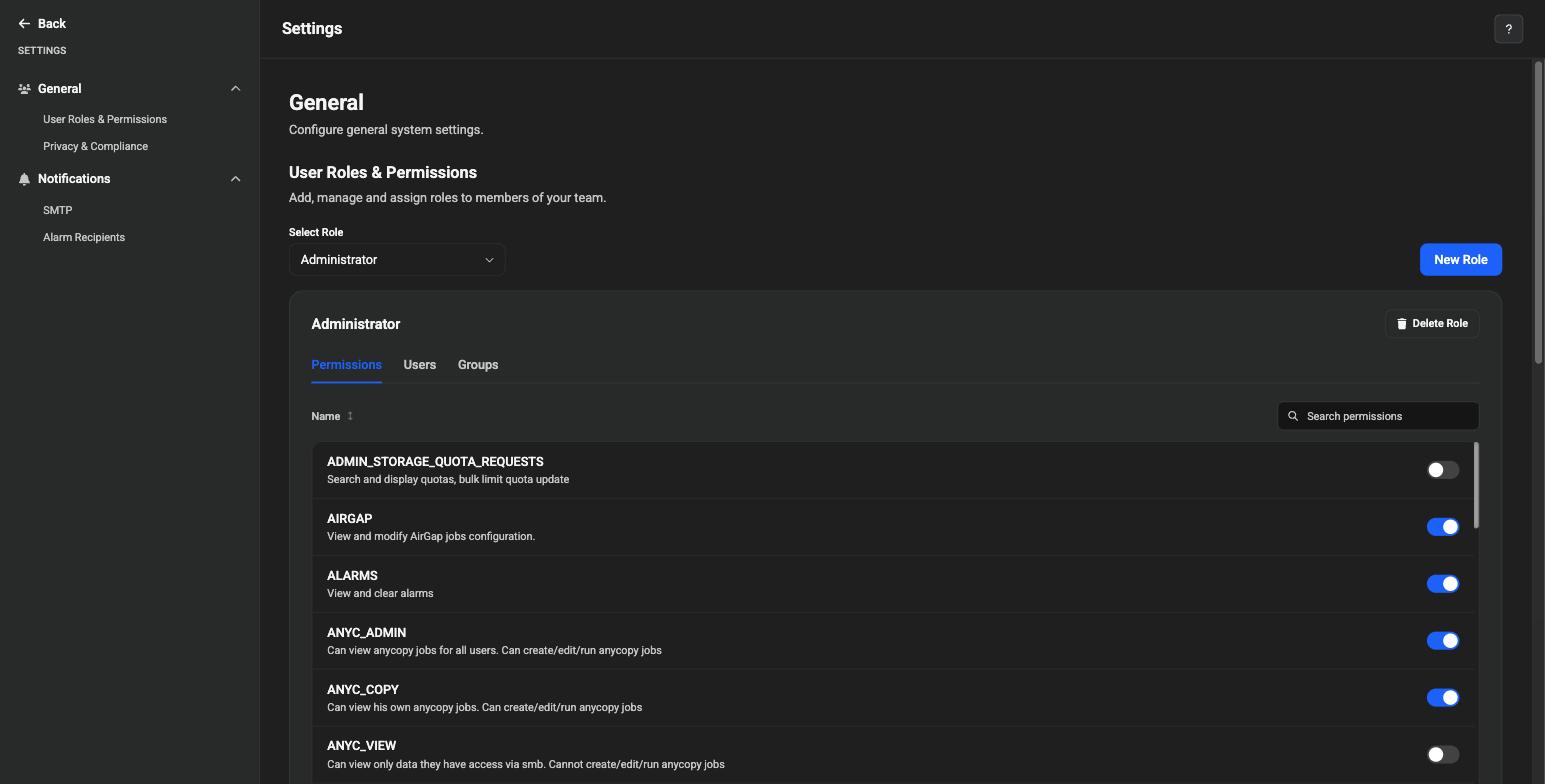
The platform-level Settings page is reached from the gear icon in the top-right corner of any page (next to the help icon), not from the Data Security sidebar — it applies across the whole portal, not just Data Security. Clicking the gear opens a menu with Settings, Mode (theme), and Sign Out; selecting Settings opens a dedicated page with its own left sidebar, organized into General (User Roles & Permissions, Privacy & Compliance) and Notifications (SMTP, Alarm Recipients).
User Roles & Permissions lets you add, manage, and assign roles, with a per-role permissions table (search/toggle individual permissions) and Users/Groups tabs. The User Roles icon on the legacy icon grid is its closest legacy equivalent (see Where things moved below).
Privacy & Compliance covers the End User License Agreement (EULA) and a Phone Home & Telemetry toggle. Notifications configures how the platform sends email: an SMTP Server table (host, port, authentication), a Test Email sender, and an Alarm Recipients table listing who receives which message types.
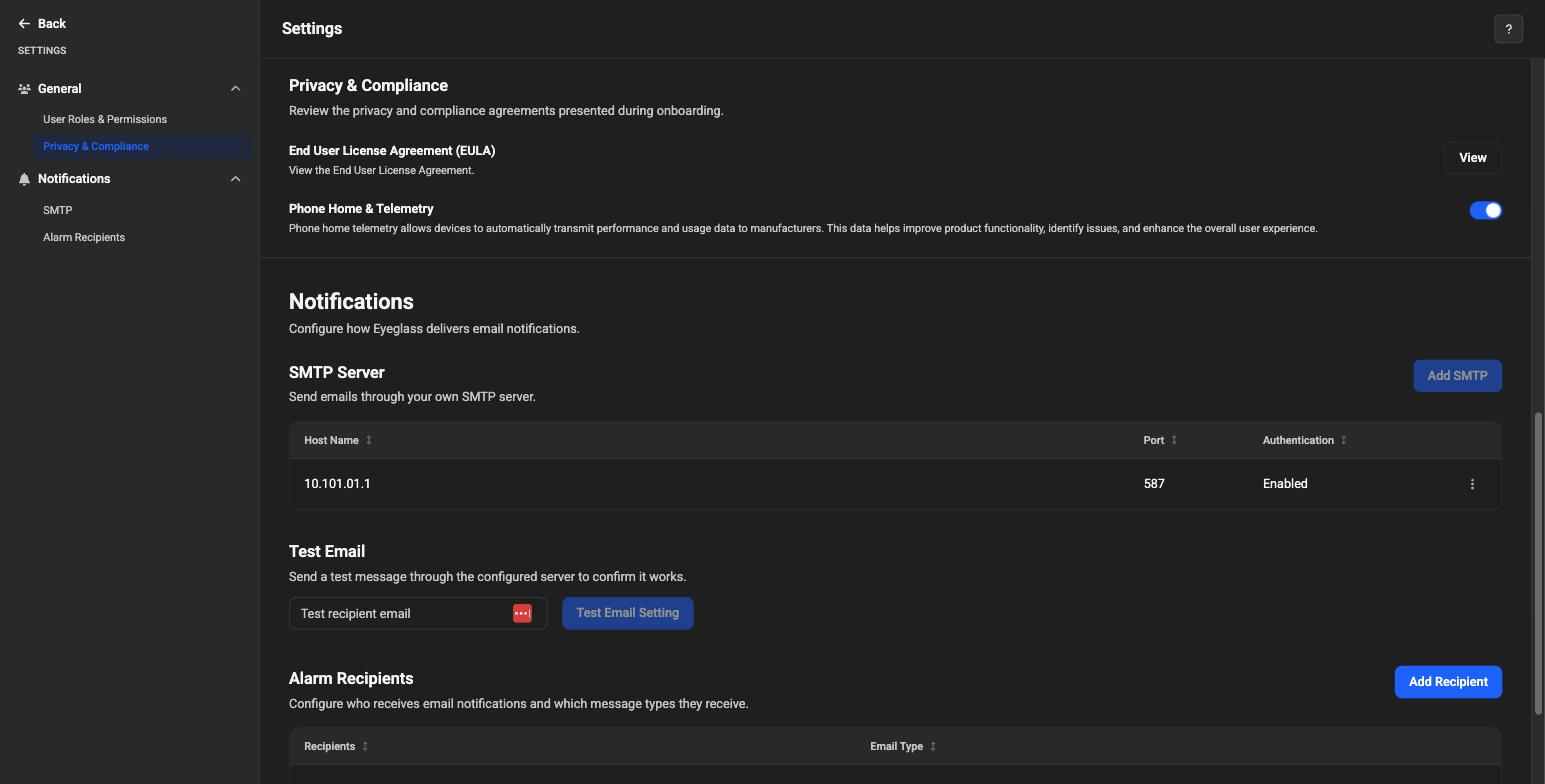
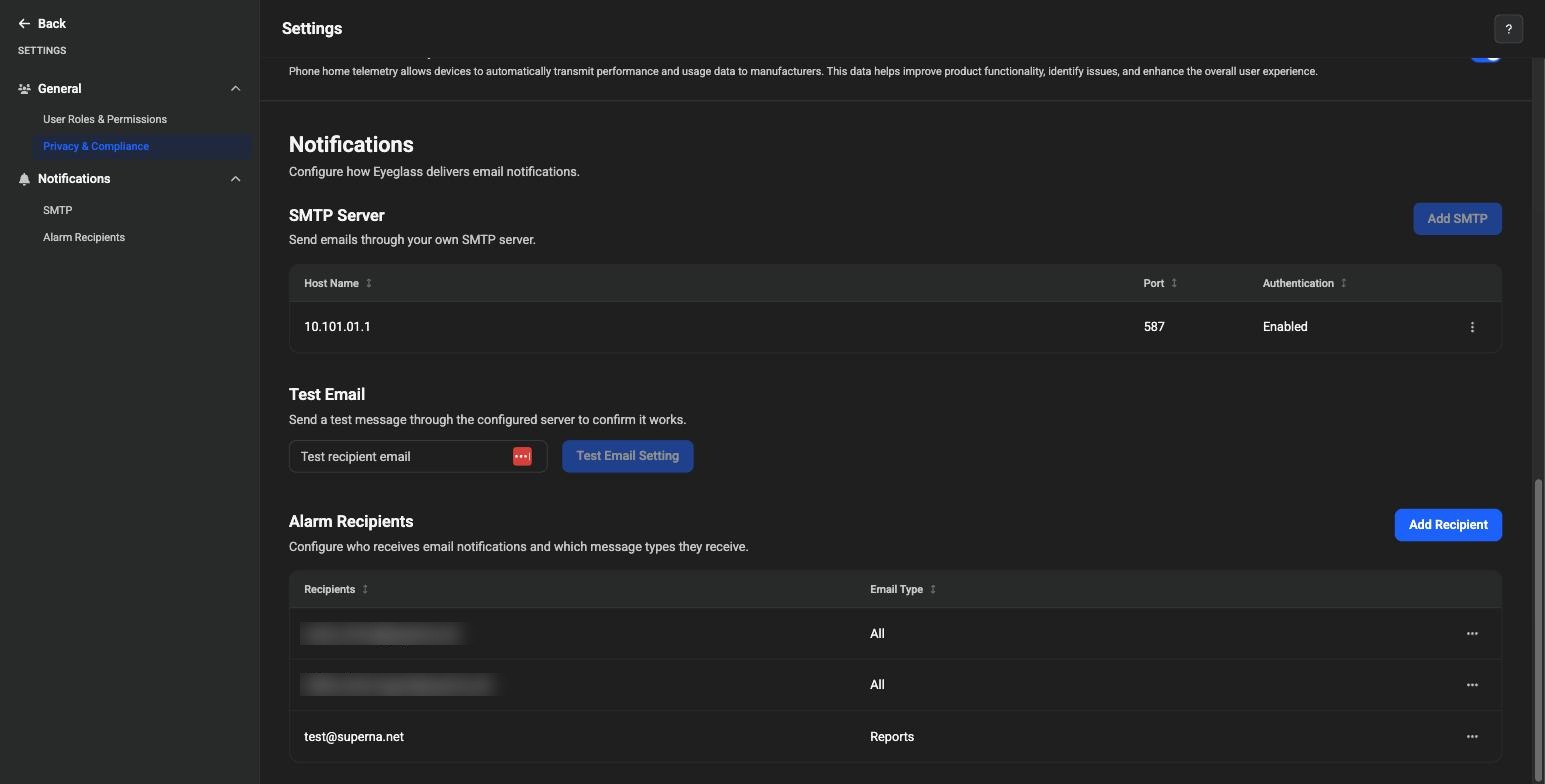
The "Where things moved" table below documents the legacy equivalents for User Roles & Permissions (the legacy User Roles icon) and Privacy & Compliance (the legacy About / Contact icon).
This Settings page is platform-level and identical regardless of which product area you're in when you click the gear icon. It's included here as well as on the Disaster Recovery and AirGap New User Experience pages, since it applies across the whole portal rather than to any one product.
Where things moved
If you are coming from the legacy interface, use this table to find familiar tasks in the new navigation:
| Legacy location | New location |
|---|---|
| Ransomware Defender icon → Alerts | Threat Detections (left sidebar, under Data Security) |
| Ransomware Defender → Settings → Thresholds | Threat Detections → Detection Controls → Settings → Advanced Severity Levels |
| Ransomware Defender → Settings → Ignore List / Monitor List | Threat Detections → Detection Controls → Ignored List and Monitor Only |
| Ransomware Defender → Settings → File Filters | Threat Detections → Detection Controls → Suspicious Extensions |
| Easy Auditor → Active Auditing (Mass Delete, DLP, Custom Triggers) | Threat Detections → Detection Controls → Active Auditor |
| Easy Auditor → Queries and Reports, Wiretap, Bulk Ingest | Data Auditing (left sidebar, under Data Security) |
| Integrations icon → Webhooks, API Tokens, API Explorer | Integrations (left sidebar, under Data Security) — Webhooks and API Tokens carry over as tabs; API Explorer is now a link in the API Tokens tab's header rather than its own tab. The redesigned page also adds a Third-Party Tools tab, a new catalog of pre-built integration guides (Abstract Security, CrowdStrike, Jira Software, and others) that did not exist in the legacy UI |
| Alert Overview → Recovery Manager tab | Investigate & Recover → Items & Recovery tab, reached from an event on the Threat Detections page |
| Security Guard and Robo Audit configuration | Health Check → Settings (see Health Check for details) |
| Manage Services icon (ECA Monitor / ECA Health Check) | Health Check → Manage Services tab |
| Log Parser icon | Health Check → Log Parser tab |
| Inventory View icon | Inventory (shared, top of sidebar) |
| License Management icon | Inventory → License Management tab |
| Add Managed Device (toolbar icon) | Inventory → Add Device button |
| Alarms icon | Alarms (shared, top of sidebar) — reorganized into Active, Closed, Managed Devices, and Alarm Controls tabs (not a direct carryover of the legacy views). Adds summary cards (active/critical counts, affected devices), filter chips for severity, product, code, and time, a per-row Clear action, and pagination. |
| Jobs icon | Jobs (shared, top of sidebar) — reorganized into Runs and Job Definitions tabs (not a direct carryover of the legacy views). Runs is a master-detail view: a list of job executions on the left, with a Job Tree and Errors panel on the right showing per-step duration, plus Download and Copy actions. |
| User Roles icon | Settings (gear icon on the User Profile menu, top-right) → User Roles & Permissions |
| About / Contact icon | No single equivalent — functionality is split between Inventory → Manage Devices (package/version info) and Settings → Privacy & Compliance (EULA, Phone Home & Telemetry) |
| Cluster Storage Usage icon | Retired. Opening it now shows "This product is deprecated." No 2.15.0 replacement exists. |
| Network Visualization icon | Not yet available in the new interface as of this release. |
| Quickstart icon | No direct equivalent — the legacy icon linked out to the Superna documentation portal rather than an in-app screen. The closest 2.15.0 equivalent is the help (?) icon in the top-right of any page. |
Terminology changes
- Alerts are now called threat detections, shown on the Threat Detections page. Security event survives in informal use, but threat detection is the official term.
- The Alert Overview page is now the Investigate & Recover page, with four tabs: Items & Recovery, Snapshots, Assets, and Activity Log.
- Closing an event is now done through the guided Close Event wizard, which replaces the previous single-step closure action and adds an explicit learning-scope step when an event is closed as False Positive.
- Recovery Manager is available directly from the Items & Recovery tab (and from the Take an Action menu on the Threat Detections page) rather than as a separate tab on the alert overview.
Cyber Recovery Manager support for Active Auditor events is new in the 2.15.0 release. ECS object recovery through Recovery Manager remains available in the legacy UI only as of this release — see Lockout Settings — ECS object storage lockout.
Dashboard and health indicators
The Health Check page continues to show a pass-rate status on each tool's card (Security Guard, Robo Audit), based on its last ten runs:
- Green — more than 7 of the last 10 runs passed
- Amber — 5 to 7 of the last 10 runs passed
- Red — fewer than 5 of the last 10 runs passed
See also
- Threat Detections — Reviewing and responding to security events in the new interface.
- Detection Controls and False Positive Management — Full configuration reference for the Detection Controls tabs.
- Threat Detection and Severity Settings — Detector types, severity levels, and enforcement modes.
- Data Auditing — Queries & Reports, WireTap, and Bulk Ingest.
- Use Cases — End-to-end scenarios showing these features working together.