Splunk Enterprise Integration with Zero Trust Alarms
Support Statement
This documentation is provided "as is" without support for 3rd party software. The level of support for this integration guide is best effort without any SLA on response time. No 3rd party product support can be provided by Superna directly. 3rd party components require support contracts. See EULA for more details.
Overview
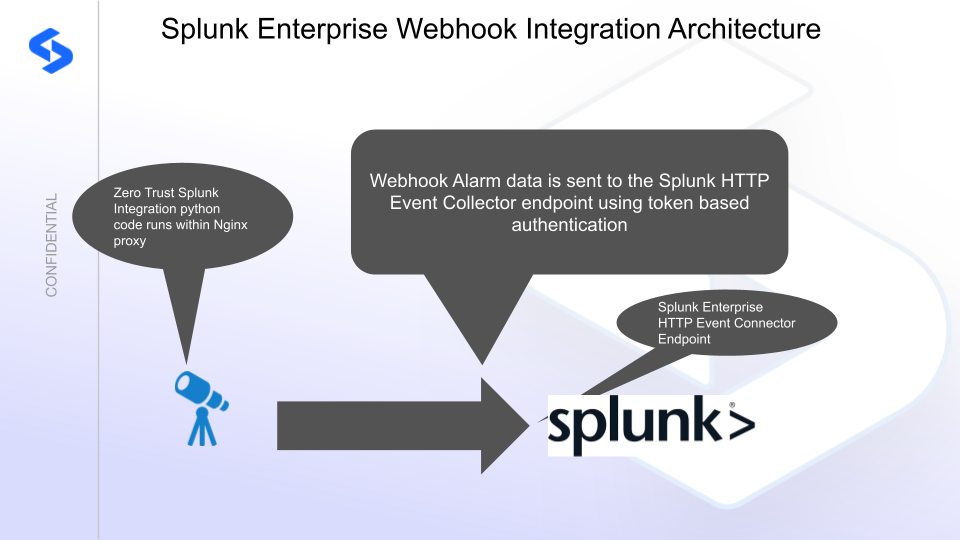
Customers using Splunk Enterprise can leverage this integration to send real-time Zero Trust alerts using webhooks and maintain full payload parsing using JSON-defined fields. The Splunk HTTP Event Connector capability allows inbound webhook JSON payloads to be parsed and tagged with a source type to allow for dashboards and triggers to be used in workflows.
Limitations
HTTPS with unsigned certificates is the default configuration, and certificate checking has been disabled in this sample code.
Solution Overview
Superna Defender Zero Trust API is the cornerstone technology used to integrate with SIEM, SOAR, and XDR platforms. Automation begins with data that summarizes the threat and places that information into a security tool to be acted on by SecOps teams. The Splunk platform can dynamically extract fields encoded in the alert payload and expose them in the index as key-value pairs.
What Is Splunk Enterprise?
Splunk Enterprise enables organizations to search, analyze, and visualize data gathered from IT infrastructure or business components, and to create triggers, workflows, and dashboards for monitoring critical infrastructure.
Integration Architecture
Solution Configuration in Splunk Enterprise and Defender Zero Trust
Prerequisites
- Installed Ransomware Defender and/or Easy Auditor or Defender for AWS
- Eyeglass OS appliance version 15.5 — verify with
cat /etc/os-release - License key for the Zero Trust API
Configuration in Splunk Enterprise
- Log in to the console and navigate to Settings → Data Input → HTTP Event Collector.
- Fill in the fields and enable all indexes, setting the default to Main.
- Click Submit.
- Go back to Data Inputs → HTTP Event Collector and click Global Settings:
- Set the default source type to
_json - Click Enable All Tokens
- Click Save
- Set the default source type to
- On the list of HTTP Event Tokens, record the token value for use in the Python code. Click the token field to copy the value.
Configuration Steps on Eyeglass Virtual Machine
High-Level Steps
- Create the Python location to run the application on the Eyeglass VM.
- Create the Python main application script.
- Create the Linux systemd service and set it to auto-start.
- Create the Zero Trust configuration in Defender.
- Update the main script to customize it with Splunk Enterprise Python code.
- Test the script is running as a service.
- Create a test event in Defender to validate alerts appear as indexed parsed events in Splunk Enterprise.
Configure the Service Start and Python Integration Files
Log in to the Eyeglass VM via SSH as the admin user:
ssh admin@<your-vm-ip>
Become root:
sudo -s

mkdir -p /opt/superna/cgi-bin

chown -R sca:users /opt/superna/cgi-bin

chmod -R u+rwX,g+rwX /opt/superna/cgi-bin
Switch to the SCA user:
sudo -u sca -s

cd /opt/superna/cgi-bin
Create a Python virtual environment for the integration:
python3 -m venv venv-splunk

source venv-splunk/bin/activate
Install required Python packages:
pip install flask boto3 requests logging

deactivate
Create integration script files:
touch splunk.py

touch splunk.sh

chmod +x splunk.py

chmod +x splunk.sh
Create the splunk.sh launch script:
nano /opt/superna/cgi-bin/splunk.sh
Paste the following content into the file:
#!/bin/bash

export PATH="/opt/.pyenv/bin:$PATH"

source /opt/superna/cgi-bin/venv-splunk/bin/activate

exec python /opt/superna/cgi-bin/splunk.py
Make the script executable:
chmod +x /opt/superna/cgi-bin/splunk.sh
Exit back to root:
exit

whoami # confirm you are root
Create the systemd service unit file:
nano /etc/systemd/system/splunk.service
Paste the following content into the file:
[Unit]
Description=Webhook listener for Zero Trust API translations and integrations
After=network.target

[Service]
Type=simple
User=sca
Group=users
WorkingDirectory=/opt/superna/cgi-bin
ExecStart=/bin/bash /opt/superna/cgi-bin/splunk.sh
Restart=always
RestartSec=5

[Install]
WantedBy=multi-user.target
Reload systemd to register the new service:
systemctl daemon-reload
Enable the service to start on boot (do not start it yet):
systemctl enable splunk
Configure Python Packages and Customize the Integration Code
-
Download the Python template code from the link to download (right-click, save as).
-
Open the Python template file in a text editor. Only replace the placeholder values — do not delete any commas.
-
Locate the following section and replace the placeholder values with your Splunk HEC token and URL:
SPLUNK_HEC_TOKEN = 'xxxxxxxxxxxxxxxx'
SPLUNK_HEC_URL = 'https://yyyyyyyyyyyyyy:8088/services/collector/event'
Replace
xxxxxwith the HEC token recorded above andyyyywith the IP address of the Splunk server running the HTTP Event Collector. -
Open the production file on the Eyeglass VM:
nano /opt/superna/cgi-bin/splunk.py -
Open the template file locally in Notepad, select all (Ctrl+A), and copy.
-
Paste the clipboard into the SSH terminal session with the open nano editor.
-
Save the file:
- Press Ctrl+X
- Answer Yes to save and exit
-
Start the service and verify it is running:
systemctl start splunk

systemctl status -l splunk
Verify the service returns "active and running". If the service does not start, do not proceed — double-check the steps above.
Configure Defender Zero Trust Webhooks
-
Configure the Zero Trust endpoint in the Ransomware Defender Zero Trust tab.
Recommended ConfigurationSend only Critical and Major events, and only webhooks that set lockout or delayed lockout. The goal is to send findings rather than a list of alarms that do not pinpoint a security incident. Customers can customize based on specific requirements.
-
The endpoint URL uses localhost and sends webhooks to the application service listening on port 5000:
http://localhost:5000/splunk -
Add the Content-Type header with value application/json to complete the webhook configuration.
-
Click Save to commit the configuration.
-
Click Save on the main Webhook configuration page.
How to Test the Integration with Splunk Enterprise
- Download the curl command template and open it with a text editor.
- Copy all the text.
- SSH to the Eyeglass VM as the admin user.
- Paste the entire CLI command to the SSH prompt to send sample data to the running Zero Trust application.
A successfully processed webhook test returns the following text in the SSH terminal:
done sending event to Splunk and check for http 200 and success count in response
To review the process logs from the web application:
sudo -s

journalctl -f -u splunk
To log to a file and review with nano, showing only the most recent 250 lines:
journalctl -f -n 250 -u splunk > /tmp/ztwebhook.log

nano /tmp/splunk.log
The response code from the Splunk Enterprise API call should show HTTP 200 status code and successCount 1 to indicate the event was successfully created.
Log in to the Splunk Enterprise Main Dashboard and search for sourcetype="supernaZT" to locate events sent from testing.
Splunk Enterprise SecOps Administrators Integration Experience
Once the integration has been tested, you can build triggers from indexed, parsed Zero Trust fields to create automated response workflows.
Configure Data Security Essentials (DSE)
Overview
Data Security Essentials saves alerts to the Windows Event log under a custom application log. This integration extracts the log entries and the JSON payload contained within them, formats the data as webhook events, and sends them to the Splunk HEC endpoint.
Requirements
-
Follow the Splunk integration steps above to configure the integration.
-
Install Python for Windows on the Data Security Essentials host.
noteEnsure Python is installed for all users — enable the for all users option during installation.
-
The integration code matches event log entries from the following sources:
Superna Data Security Essentials BOT ServiceSuperna Data Security Policy Engine
Features
- Execution logs are stored alongside the Python code
- Each execution stores the event log record ID, date time, and event number of the last processed event in
last_processed_record.txt— read on each execution to continue from the last record - The scheduled sync runs every minute and processes only events since the last record
- Only Major and Critical severity events are processed — other severities are ignored
Steps to Configure Event Sync to Splunk Integration
-
Download the integration code (right-click, save as).
-
Modify the Python file and update the Splunk integration settings to match your environment:
# Splunk HEC authentication
SPLUNK_HEC_TOKEN = 'xxxxxxx'
SPLUNK_HEC_URL = 'https://yyyyyy:8088/services/collector/event'

# Configuration
server = 'localhost'
log_name = 'Data Security Essentials'
source_names = ['Superna Data Security Essentials BOT Service', 'Superna Data Security Policy Engine']
trigger_severities = ['MAJOR', 'CRITICAL', 'WARNING'] -
Copy the Python code to
C:\Program Files\Superna\cgi-binon the Data Security Essentials host and name the filesplunk-dse.py. -
Install Python dependencies:
noteOpen a command prompt as the service account (hold down Shift and right-click the command prompt icon → Run as). This is required to install the Python packages under the correct user account.
pip install pywin32 requests -
Test the script from a command prompt:
cd "C:\Program Files\Superna\cgi-bin"
python splunk-dse.py
The output should display event log entries that match, ignoring severities that do not match the script settings. You can review
last_processed_record.txtto see the last processed date, time, and event ID. Delete this file to have the script start reading from the oldest Windows event log entry.An example log file is available: right-click to download and open.
-
Grant the Data Security Essentials AD service account the Log on as a batch job right via Local Security Policy (
secpol.msc). -
Download the Task Scheduler XML file (right-click, save as). You can rename it from
Servicenow alert sync.xmltoSplunk integration.xml. -
Open Task Scheduler (
taskschd.msc), right-click Task Scheduler Library, and select Import Task. -
In the task definition:
- Edit the name to
Splunk integration - Click the Actions tab and browse to select
C:\Program Files\Superna\cgi-bin\splunk-dse.py - Update the service account name, domain, and password
- Click OK to save
- Edit the name to