ElasticSearch SIEM Zero Trust Alert Integration
Support Statement
This documentation is provided "as is" without support for 3rd party software. The level of support for this integration guide is best effort without any SLA on response time. No 3rd party product support can be provided by Superna directly. 3rd party components require support contracts. See EULA for more details.
Overview
Elastic SIEM is a powerful security platform built on top of the Elastic Stack, which includes Elasticsearch, Logstash, and Kibana. It provides a centralized way to collect, normalize, and analyze security-related data from various sources, offering real-time threat detection and response capabilities.
Solution Overview
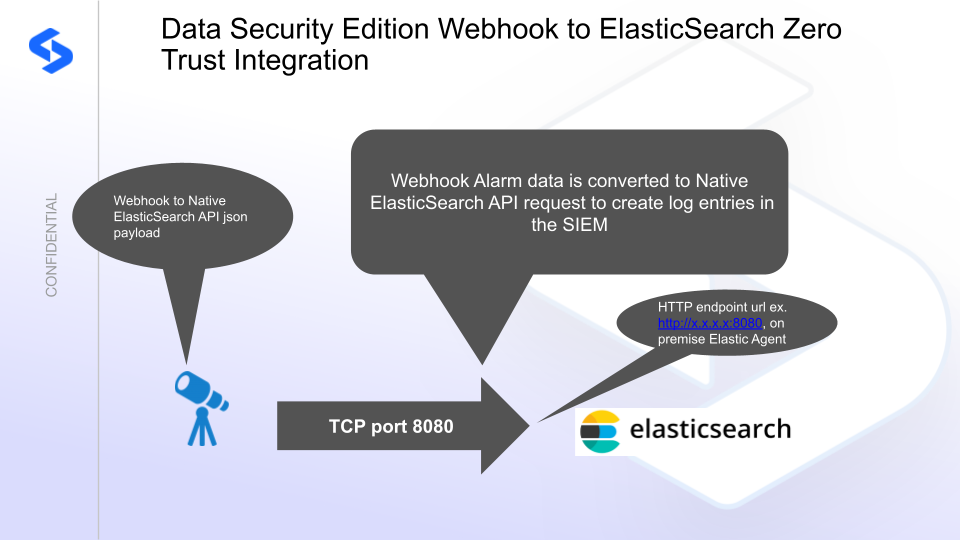
Superna Defender Zero Trust API receives webhook alerts and parses the key data into HTTP API payload events that are sent to the ElasticSearch SIEM endpoint URL. The ElasticSearch solution uses the Custom HTTP Endpoint Logs Integration.
Advanced Zero Trust Capabilities
- Webhook to native HTTP endpoint with JSON custom payload
What Is ElasticSearch SIEM?
Elastic SIEM is a powerful security platform built on top of the Elastic Stack, which includes Elasticsearch, Logstash, and Kibana. It provides a centralized way to collect, normalize, and analyze security-related data from various sources, offering real-time threat detection and response capabilities.
Integration Architecture
Solution Configuration in ElasticSearch SIEM and Data Security Edition Zero Trust
Prerequisites
- Installed Security Edition
- Eyeglass OS appliance version 15.5 — verify with
cat /etc/os-release - License key for the Zero Trust API
- ElasticSearch SIEM (on-premises or SaaS)
Configuration in ElasticSearch SIEM
-
Log in to the Elastic console and select Project settings → Integrations.
-
Select Custom HTTP Endpoint Logs.
-
Click the install option and follow the Elastic Agent installation guide to install an agent on an on-premises host that has IP reachability to the Eyeglass VM on TCP port 8080.
noteRecord the IP address of the Elastic Agent — this is used in the Eyeglass integration code to send formatted JSON payload alerts to the Elastic Agent over port 8080.
-
Click Add Custom HTTP Endpoint Logs integration.
-
Change the listening address from
localhostto0.0.0.0to accept connections from the Eyeglass VM. Leave all other defaults to create the agent and HTTP policy.
The HTTP endpoint agent accepts HTTP over port 8080 with a JSON payload that is indexed using json.fieldname within the index.
Configuration Steps on Eyeglass Virtual Machine
High-Level Steps
- Create the Python location to run the application on the Eyeglass VM.
- Create the Python main application script.
- Create the Linux systemd service and set it to auto-start.
- Create the Zero Trust configuration in Data Security Edition.
- Update the main script to customize it with the ElasticSearch SIEM Python code.
- Test the script is running as a service.
- Create a test event in Defender to validate alerts appear as indexed parsed events in ElasticSearch SIEM.
Configure the Service Start and Python Integration Files
Log in to the Eyeglass VM via SSH as the admin user:
ssh admin@<your-vm-ip>
Become root:
sudo -s

mkdir -p /opt/superna/cgi-bin

chown -R sca:users /opt/superna/cgi-bin

chmod -R u+rwX,g+rwX /opt/superna/cgi-bin
Switch to the SCA user:
sudo -u sca -s

cd /opt/superna/cgi-bin
Create a Python virtual environment for the integration:
python3 -m venv venv-elasticsearch

source venv-elasticsearch/bin/activate
Install required Python packages:
pip install flask requests

deactivate
Create integration script files:
touch elasticsearch.py

touch elasticsearch.sh

chmod +x elasticsearch.py

chmod +x elasticsearch.sh
Create the elasticsearch.sh launch script:
nano /opt/superna/cgi-bin/elasticsearch.sh
Paste the following content into the file:
#!/bin/bash

export PATH="/opt/.pyenv/bin:$PATH"

source /opt/superna/cgi-bin/venv-elasticsearch/bin/activate

exec python /opt/superna/cgi-bin/elasticsearch.py
Make the script executable:
chmod +x /opt/superna/cgi-bin/elasticsearch.sh
Exit back to root:
exit

whoami # confirm you are root
Create the systemd service unit file:
nano /etc/systemd/system/elasticsearch.service
Paste the following content into the file:
[Unit]
Description=Webhook listener for Zero Trust API translations and integrations
After=network.target

[Service]
Type=simple
User=sca
Group=users
WorkingDirectory=/opt/superna/cgi-bin
ExecStart=/bin/bash /opt/superna/cgi-bin/elasticsearch.sh
Restart=always
RestartSec=5

[Install]
WantedBy=multi-user.target
Reload systemd to register the new service:
systemctl daemon-reload
Enable the service to start on boot (do not start it yet):
systemctl enable elasticsearch
Configure Python Packages and Customize the Integration Code
-
Download the Python template code from the link to download.
-
Open the Python template file in a text editor. Only replace the placeholder values — do not delete any commas.
-
Locate the following section and replace the placeholder with your ElasticSearch SIEM on-premises endpoint URL:
# ElasticSearch SIEM HTTP Collector Endpoint
elastic_URL = "https://x.x.x.x:8080/"
ElasticSearch SIEM SaaS: To use a SaaS endpoint, modify the headers section by replacing it with the following block and replace the placeholder with your API token:
ELASTIC_HEADERS = {
    "Content-Type": "application/json",
    "Authorization": "Basic yyyyyyyyyy"
} -
Open the production file on the Eyeglass VM:
nano /opt/superna/cgi-bin/elasticsearch.py -
Open the template file locally in Notepad, select all (Ctrl+A), and copy.
-
Paste the clipboard into the SSH terminal session with the open nano editor.
-
Save the file:
- Press Ctrl+X
- Answer Yes to save and exit
-
Start the service and verify it is running:
systemctl start elasticsearch

systemctl status -l elasticsearch
Verify the service returns "active and running". If the service does not start, do not proceed — double-check the steps above.
Configure Defender Zero Trust Webhooks
-
Configure the Zero Trust endpoint in the Ransomware Defender Zero Trust tab.
Recommended ConfigurationSend only Critical and Major events, and only webhooks that set lockout or delayed lockout. The goal is to send findings rather than a list of alarms that do not pinpoint a security incident. Customers can customize based on specific requirements.
-
The endpoint URL uses localhost and sends webhooks to the application service listening on port 5000:
http://localhost:5000/webhook -
Add the following headers to complete the webhook configuration:
- Content-Type:
application/json - content-encoding:
gzip
- Content-Type:
-
Click Save to commit the configuration.
-
Click Save on the main Webhook configuration page.
How to Test the Integration with ElasticSearch SIEM
- Get the IP address of the Eyeglass VM.
- Download the curl command template and open it with a text editor. Locate the IP address of Eyeglass at the very end of the text and replace it with the IP address of your Eyeglass VM.
- Copy all the text in the text editor.
- SSH to the Eyeglass VM as the admin user.
- Paste the entire CLI command to the SSH prompt to send sample data to the running Zero Trust application. This sends test data directly to the application to be processed and sent to ElasticSearch SIEM.
A successfully processed webhook test returns the following text in the SSH terminal:
done sending event to ElasticSearch SIEM and check for http 200 and success count in response
To review the process logs from the web application:
sudo -s

journalctl -f -u elasticsearch
To log to a file and review with nano, showing only the most recent 250 lines:
journalctl -f -n 250 -u elasticsearch > /tmp/elasticsearch.log

nano /tmp/elasticsearch.log
The response code from the ElasticSearch SIEM API call should show HTTP 200 status code and successCount 1 to indicate the event was successfully created.
ElasticSearch SIEM SecOps Administrators Integration Experience
Once the integration is complete, SecOps administrators can view indexed events in the ElasticSearch SIEM console. The following fields from the Superna Zero Trust webhook payload are indexed and available for search and alerting:
| Field | Description |
|---|---|
json.action | Action taken |
json.Alert_url | Alert URL |
json.client_ip | Client IP address |
json.detected | Detection timestamp |
json.severity | Alert severity |
json.user | Affected user |
json.files | Affected files |
json.shares | Affected shares |
json.state | Alert state |
json.protocol | Protocol used |
json.device_vendor | Vendor (Superna) |
json.device_product | Product (Data Security Edition) |