Automated Installation
The automated installation service provides a streamlined approach to deploying the threat hunting module with simplified configuration and reduced manual steps.
Before starting the automated installation, review the system requirements and gather the necessary configuration details in the Before You Begin — System Requirements and ML VM Installation section.
Kubernetes OVF Setup
-
Download the Kubernetes OVF from the software downloads page.
-
Deploy the OVF through VMware vCenter and fill in the fields in the Customize Template step as shown in the table below.
Section Label Fill In? Notes General Data disk size Yes GB, default 40 (min 40) General ClickHouse disk size Yes GB, default 200 (min 200) General PostgreSQL disk size Yes GB, default 20 (min 20) ARK Create Data Disk Filesystem Yes Default true — auto-creates the data disk filesystem on boot ARK IP Access Only Yes Default true — exposes services via TCP port; disable for HTTP host-based routing ARK Modules Leave empty Non-TH feature (module selection) — do not fill in ARK Distribution URL Leave empty Non-TH feature (custom distribution source) — do not fill in Kubernetes Deployment Mode Yes Keep default serverfor Threat Hunting single-node deploymentsKubernetes Cluster Join Token Leave empty Non-TH feature (multi-node clustering) — do not fill in Kubernetes Cluster FQDN Leave empty Non-TH feature (multi-node clustering) — do not fill in Kubernetes Node FQDN Yes Alphanumeric, dots, hyphens only. Example: node1.example.comNetwork mgmt IP Yes Example: 192.168.1.50Network mgmt Netmask Yes Default 255.255.255.0Network mgmt Default Gateway Yes Example: 192.168.1.1Network mgmt Virtual IP Leave empty Non-TH feature (HA failover) — do not fill in Network DNS Yes Comma-separated. Example: 192.168.1.10Network NTP Servers Yes Comma-separated. Example: pool.ntp.orgNetwork Domain Search List Optional Comma-separated — fill in only if your environment requires it
Default VM Credentials
After deploying and powering on the virtual machine, log in using the default credentials.
If you do not have the default credentials, contact Superna Support or visit the Superna Support Portal.
For security reasons, change the default password immediately after first login.
Installation Process
Configure ECA Nodes for Kafka Connection
Configure the ML module IP address so the threat hunting module can connect to ECA Kafka services.
-
Connect to ECA node 1 using SSH with the ecaadmin user credentials.
-
Stop the cluster:
ecactl cluster down -
Open the ECA environment configuration file:
vim /opt/superna/eca/eca-env-common.conf -
Add the following line. Replace
<yourip>with your threat hunting module host IP address:export ML_MODULE_IP=<yourip> -
Save the file and exit the editor.
-
Start the cluster:
ecactl cluster up
Enable Threat Hunting Module in Eyeglass
-
Use SSH to connect to the SCA VM with administrator credentials.
-
Open the system configuration file:
nano /opt/superna/sca/data/system.xml -
Locate the
<th_enabled>parameter and set its value totrue:<th_enabled>true</th_enabled> -
Apply the configuration changes by restarting the SCA service:
systemctl restart sca
Download and Run the Installer
-
Download the installer from the Superna software downloads page and transfer it to the following directory on the Threat Hunting appliance:
/opt/ark/home/th-module -
Unzip the installer and run it to extract the offline package:
chmod +x thm-<LATEST_VER>.run
./thm-<LATEST_VER>.run
If zypper fails to install packages, run these commands and try the installation again:
# See repos (note the repo name and number)
sudo zypper lr -u
# Disable the CD/DVD repo by NAME (preferred)
sudo zypper mr -d 'openSUSE-Leap-15.6-1'
# or disable by NUMBER if it's, say, 1
sudo zypper mr -d 1
# Refresh again
sudo zypper ref
Configure Installation
Update the installer_vars.yaml file with your environment-specific values before running the installation script. This configuration file contains all the parameters needed for your specific deployment environment.
Configuration File Structure
The installer_vars.yaml file is structured into logical sections, each containing related configuration parameters. All parameters include detailed comments explaining their purpose and how to obtain the correct values.
File Location:
th-module/
├── offline-installer.sh
├── installer_vars.yaml          # ← Main configuration file
└── .installation/               # Generated during installation (temporary files)
Required Configuration Steps
-
Navigate to the configuration file:
nano installer_vars.yaml -
Update the following required sections with your environment-specific values:
ML Module Configuration
# ========================================
# ML Module Configuration
# ========================================
ml_module:
  # IP address where the ML module services will be accessible
  # This should be the IP of your VM
  ip: "YOUR_ML_MODULE_IP"
Required Information:
- ML Module IP: The IP address of the OpenSUSE server/VM where the ML module will be installed
- How to obtain: Contact your network administrator or check the server's network configuration with
ip addr showorifconfig.
Eyeglass Integration Configuration
# ========================================
# Eyeglass Integration Configuration
# ========================================
eyeglass:
  # Eyeglass server IP address for integration
  ip: "YOUR_EYEGLASS_IP"

  # Public key for Eyeglass authentication (value of the eca node file /opt/superna/eca/data/common/.secure/rsa/isilon.pub)
  public_key: "YOUR_ECA_PUBLIC_KEY"

  # Sera token from Eyeglass UI - Integrations - Api Tokens
  token: "YOUR_EYEGLASS_TOKEN"

  # Appliance ID from Eyeglass for platform identification
  # To get this value, open a shell to the Eyeglass VM and run:
  # igls admin appid
  appliance: "YOUR_APPLIANCE_ID"
Required Information:
- Eyeglass IP: IP address of your Eyeglass server. Replace the placeholder/empty value.
- Public Key: ECA connection key. Replace the placeholder/empty value. Paste as a single line string. Do not include the separators BEGIN/END PUBLIC KEY. Example:
public_key: "ssh-rsa AAAAB3NzaC1yc2EAAAADAQABAAABAQ...==". - Sera Token: Eyeglass access API. Replace the placeholder/empty value.
- Appliance: Eyeglass Unique App ID. Replace the placeholder/empty value.
Release and Version Configuration
# ========================================
# Release and Version Configuration
# ========================================
# Version of SEED ML platform to install
release: "1.2.0"
Update to the version to be installed.
Database Configuration
# ========================================
# Database Configuration
# ========================================
# ClickHouse database password for analytics data
clickhouse_pass: "Clickhouse.Change-me.2025"
# PostgreSQL admin password for application data
postgres_admin_pass: "Postgres.Change-me.2025"
# Apache Superset admin user password for dashboards
superset_admin_user_pass: "Superset.Change-me.2025"
# Superset secret key for session encryption
superset_secret_key: "Change-it-2024"
Security Requirements:
- Change all default passwords - Never use the example passwords in production
- Use strong passwords with mixed case, numbers, and special characters
- Minimum 12 characters recommended
- Store passwords securely and restrict access to configuration file
Kafka Cluster Configuration
# ========================================
# Kafka Cluster Configuration
# ========================================
# List of Kafka brokers. Corresponds to the ips and names of all eca clusters.
# To get this info, login to eca node 1 and run: ecactl cluster exec docker exec kafka cat ./config/server.properties | grep listeners=
kafka:
  - ip: "YOUR_ECA_NODE1_IP"
    port: 9092
    hostname: "YOUR_ECA_NODE1_HOSTNAME"
  - ip: "YOUR_ECA_NODE2_IP"
    port: 9092
    hostname: "YOUR_ECA_NODE2_HOSTNAME"
Required Information for Each Kafka Node:
- IP Address: Network IP address of the Kafka broker
- Port: Kafka broker port (standard: 9092)
- Hostname: Fully qualified domain name of the Kafka node
How to obtain Kafka brokers configuration:
- Connect to ECA Node: SSH to ECA node 1 as ecaadmin
- Get kafka brokers information: Run:
ecactl cluster exec docker exec kafka cat ./config/server.properties | grep listeners=to get kafka brokers ip and hostname
noteYou will see something like
ecaadmin@jmseca1-1:~> ecactl cluster exec docker exec kafka cat ./config/server.properties | grep listeners=
#advertised.listeners=PLAINTEXT://your.host.name:9092
listeners=PLAINTEXT://kafka.node1.jmseca1.eca.local:9092
Connection to 10.152.1.148 closed.
# advertised.listeners=PLAINTEXT://your.host.name:9092
listeners=PLAINTEXT://kafka.node2.jmseca1.eca.local:9092
Connection to 10.152.1.149 closed.
# advertised.listeners=PLAINTEXT://your.host.name:9092
listeners=PLAINTEXT://kafka.node3.jmseca1.eca.local:9092
Connection to 10.152.1.150 closed.
Example with multiple nodes:
kafka:
  - ip: "10.152.1.148"
    port: 9092
    hostname: "kafka.node1.jmseca1.eca.local"
  - ip: "10.152.1.149"
    port: 9092
    hostname: "kafka.node2.jmseca1.eca.local"
Network Requirements:
- Ensure the ML module can reach port 9092 on all Kafka nodes.
- Verify DNS resolution for Kafka hostnames from the ML module server.
Training Delta Time Configuration
training_delta_timeis a time offset, not a window length. It sets how far back from now the training data starts, and everything newer than the offset is left out. A larger value therefore means less recent data, not more.# ========================================
# Training Delta Time Configuration
# ========================================
# Time offset to apply when training ML models.
# Use 1 HOUR for the very first training run, and 48 HOURS for steady-state operation.
training_delta_time:
# Numeric value for the time offset
value: 1
# Time unit for the offset value
# Valid values based on Java ChronoUnit (MINUTES, HOURS, DAYS, WEEKS, MONTHS, YEARS)
unit: "HOURS"Mode Setting What it does Bootstrap (first training) 1 HOUR Excludes only the last hour, so the training uses almost all of the collected data. This gives the first model the most data. Steady state (production) 48 HOURS Skips the last two days. The data settles, and recent unreviewed events stay out of training. For the steady-state schedule, see Switch to the Steady-State Schedule.
Allowed Paths Configuration
Filter paths to be processed by the Kafka pipeline based on file path patterns. Default value empty to process all events:
pipelines:
  # Filter paths to be processed by the Kafka pipeline based on file path patterns.
  # If not specified or empty, all paths received by the ML module will be processed.
  # Supports glob patterns for flexible path matching.
  # Examples:
  #   - "**/data/**"
  #   - "/example/test*"
  allowed-paths:
    - "**/data/**"
Denied Extensions Configuration
File extensions to exclude from processing:
pipelines:
  # File extensions to exclude from processing by the ML module.
  # These transitory and temporary file extensions are denied by default.
  # Adjust according to client requirements and environment specifics.
  denied-extensions:
    - ".tmp"
    - ".crdownload"
    - ".log"
    - ".part"
    - ".ismv"
    - ".isma"
    - ".bak"
    - ".zip"
    - ".bin"
    - ".nfs*"
Replica Configuration
Internal configuration for Kafka pipeline replicas. Internal configuration to be changed when kafka partitions are higher than default value (9). Do not touch if unsure:
pipelines:
  # Replica configuration for the Kafka pipeline service in the Kubernetes cluster
  # The number of replicas depends on the number of partitions in the 'eyeglassevents' Kafka topic
  # Default: 4 replicas for 9 partitions (default topic configuration)
  # Increase the replica count proportionally if the number of topic partitions is increased
  replicas: 4
UI Authentication Configuration
Define the username and password for the basic UI authentication:
# ========================================
# API Configuration
# ========================================
http-access:
  # Basic authentication configuration
  # Used as fallback authentication when an Eyeglass session cookie is not present in the request
  # Username for basic authentication
  user: mladmin
  # Bcrypt-hashed password for basic authentication. Default value: 3y3gl4ss
  # IMPORTANT: Password must start with {bcrypt} prefix (required by Spring Boot)
  # To generate a new password hash, use: htpasswd -bnBC 12 "" your_password. Then prepend {bcrypt} to the generated hash
  password: "{bcrypt}$2y$12$cYeF5PiZedpKxzh5NnRxy.agU9COzJc/NphibEXpjmO8dl9sZ4vw."
Training Scheduler Configuration
warningPay attention to the cron expression format, which must include seconds, so it has 6 elements, and is evaluated in UTC timezone
# ========================================
# Training Scheduler Configuration
# ========================================
# Cron-based scheduling for ML training jobs
# Format: "<cron_expression>:<cluster_name>:<path>:<model_name>"
#
# Cron format: "second minute hour day month day_of_week"
# Examples:
#   "0 0 2 * * 6" = Every Saturday at 02:00:00
#   "0 30 14 * * 1-5" = Every weekday at 14:30:00
#
# Support team: Modify these schedules as needed for your environment
training_scheduler:
- "0 0 0 * * 6:isi-mock-127:/ifs/data/aaa/AccessZoneA:data-exfil-rwmr" # 00:00 Saturday
- "0 0 1 * * 6:isi-mock-127:/ifs/data/aaa/AccessZoneA:data-exfil-rwmw" # 01:00 Saturday
- "0 0 2 * * 6:isi-mock-127:/ifs/data/aaa/AccessZoneA:data-exfil-ml1" # 02:00 Saturday
- "0 0 3 * * 6:isi-mock-127:/ifs/data/aaa/AccessZoneA:data-exfil-ml2" # 03:00 Saturday
Format Explanation:
- Cron Expression:
"0 0 0 * * 6"= Every Saturday at midnight (00:00:00) - Cluster Name: PowerScale cluster name (e.g., isi-mock-127)
noteHow to obtain This information is available in the Inventory Icon listing the the cluster name
-
Path: The full path to the area in the file system that you want to monitor for Data Exfiltration attempts
-
Model Name: Identifier for the training job type (e.g., data-exfil-rwmr). If you set this value empty then all 4 models will be trained.
Cron Format Details:
Field Allowed values Special characters Second 0-59 */,-Minute 0-59 */,-Hour 0-23 */,-Day of month 1-31 */,-?Month 1-12 or JAN-DEC */,-Day of week 0-6 or SUN-SAT */,-?Common Cron Examples:
-
"0 0 2 * * 6"= Every Saturday at 02:00:00 -
"0 30 14 * * 1-5"= Every weekday at 14:30:00 -
"0 0 */6 * * *"= Every 6 hours -
"0 0 0 1 * *"= First day of every month at midnight
Staggering the four models an hour apart, as in the example above, keeps them from competing for the same resources on the module VM.
Security Requirements- Never use default passwords in production
- Change all example passwords before installation
- Use strong passwords with mixed case, numbers, and special characters
- Minimum 12 characters recommended
- Never commit passwords to version control
-
Save file and exit
Execute Installation
-
Make the installer script executable:
chmod +x offline-installer.sh -
Run the installation script. The installation process will prompt for several inputs:
./offline-installer.shInstallation Prompts and Responses
During the installation, you'll be prompted for a few key pieces of information. Follow the recommended responses to ensure a smooth setup.
-
Configuration Validation
The script will automatically validate your installer_vars.yaml file. If any required fields are missing or invalid, you'll see errors like:
ERROR: Missing required field: ml_module.ip in installer_vars.yamlResponse: Stop the installation (Ctrl+C), fix the configuration file, and restart the installation.
Installation Progress Indicators:
During installation, you'll see progress messages like:
- "Running full installation..."
- "Adding repositories needed and updating them"
- "Building dependencies for clickhouse"
Verbose output and slow-looking image-pull progress are normal.
-
-
Confirm all pods are running successfully:
kubectl -n seed-ml get pods
Access Superset Dashboard
Importing these dashboards is optional for the module's core functionality, but it is highly recommended as they contain valuable tools for analyzing various threat huntings.
After installation completion, access the Superset dashboard using your threat hunting module IP address:
https://<THREAT_HUNTING_MODULE_IP>:30443/
Replace <THREAT_HUNTING_MODULE_IP> with your actual threat hunting module server IP address: ip addr show.
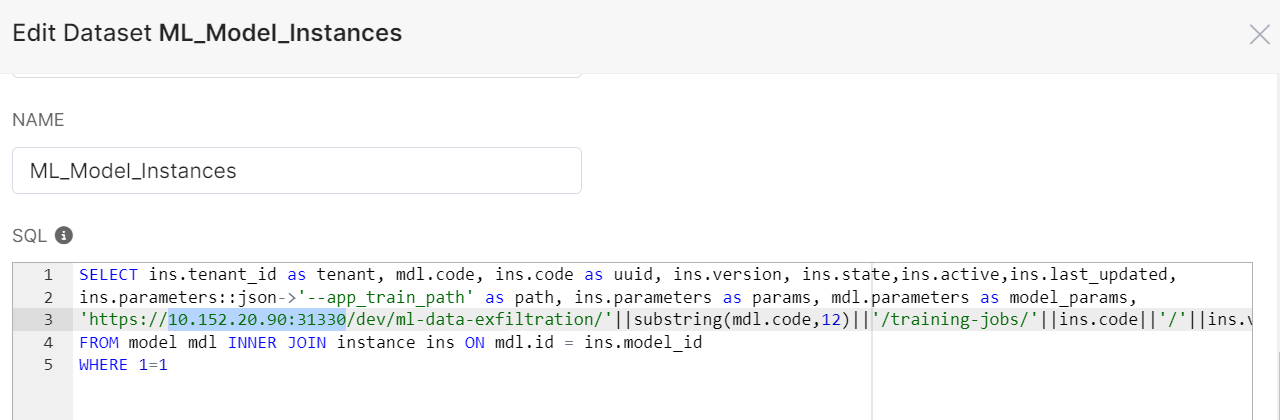
Configure the ML_Model_Instances Dataset
-
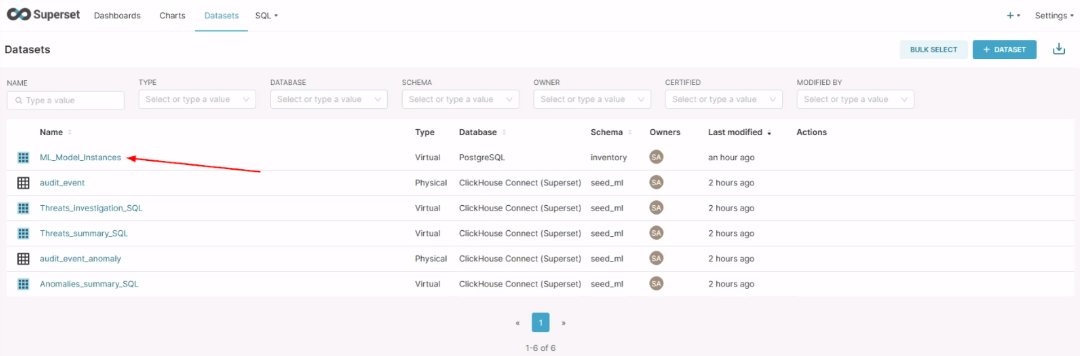
In the Superset dashboard, navigate to Datasets > ML_Model_Instances.
-
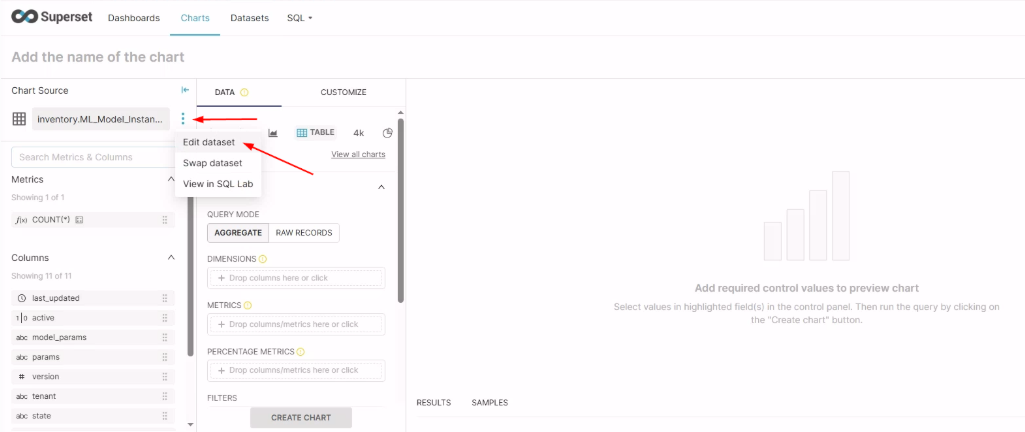
Select the three-dot menu next to ML_Model_Instances, then click Edit dataset.
-
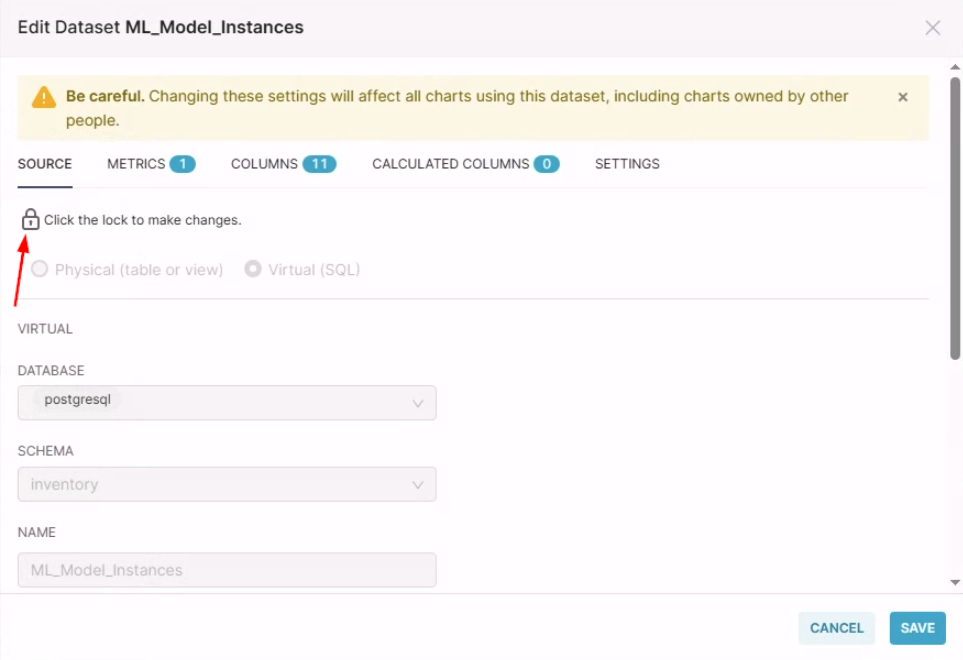
Click the padlock icon to unlock the dataset for editing.
-
Update the IP address field with your Threat Hunting module IP address.
-
Update the service URL to match your environment:
https://<THREAT_HUNTING_MODULE_IP>:31443/prod/ml-data-exfiltration/ -
In the SQL query, replace the existing IP address in the service URL with your Threat Hunting module IP address.
Verify That Audit Events Reach ClickHouse
Before you schedule any training, confirm that audit events are reaching ClickHouse. If they are not, no training or detection works, regardless of how healthy the pods look.
-
Open a ClickHouse client session on the Threat Hunting VM. Use the
clickhouse_passvalue frominstaller_vars.yaml:kubectl exec -it clickhouse-shard0-0 -n seed-ml -- \
clickhouse-client --user=admin --password='<clickhouse_pass>' -
Count the audit events:
USE seed_ml
SELECT count() FROM audit_event
A count greater than zero means ingestion is working. If the count is zero, check that Kafka is reachable (see the next section) and that auditing is enabled for the access zone on the PowerScale cluster (isi audit settings view). SMB and NFS auditing must be enabled.
Verify Kafka Connectivity
From the Threat Hunting VM, probe each Kafka broker on port 9092. Replace the IP addresses with your broker IPs:
for ip in 10.152.1.148 10.152.1.149 10.152.1.150; do
  nc -vz -w3 "$ip" 9092
done
Every broker must print a line such as Connection to 10.152.1.148 9092 port [tcp/*] succeeded!. If a probe fails, confirm that the ML_MODULE_IP value is correct and that the cluster restart completed on every ECA node.
Confirm the Interface Is Empty
Open the Threat Hunting interface. The Open and Closed tabs should both be empty. This is correct at this stage: no model is ACTIVE yet, so there is nothing to score against, even though the pods are running, Kafka is reachable, and ingestion is happening.
Schedule the First Training Run
Order matters. Training too early produces a sparse baseline and a flood of false positives.
-
Install and accumulate. Let real user activity accumulate. Allow 2 weeks at a minimum, to capture weekday and weekend patterns. 1 month is recommended, to capture monthly cycles.
-
Run the bootstrap training. Set
training_delta_timeto 1 hour (value: 1,unit: "HOURS") so that the first training uses almost all of the collected data, then apply the schedule:./update_training_jobs.shThe models train at the next scheduled time.
-
Verify the models. In the Threat Hunting interface, open the ML Training Jobs tab. All four models must show Active and Ready for your cluster and path. A training run takes about 10 minutes to complete, and the inventory takes about 10 more minutes to mark the model ACTIVE. To watch the training pod:
watch 'kubectl -n seed-ml get pods | grep train-ml-job'If a model is not Active, confirm that audit events exist for the monitored path. Replace
<monitored_path>with the path fromtraining_scheduler:SELECT count() FROM audit_event
WHERE startsWith(path, '<monitored_path>')A count of zero means SMB or NFS auditing is not enabled for that access zone, or the path is wrong.
Switch to the Steady-State Schedule
One to two days after the first training, when the models are ACTIVE, switch to weekly retraining. Edit installer_vars.yaml and set training_delta_time to 48 hours, so that the most recent two days stay out of training:
training_scheduler:
  - "0 0 0 * * 6:isi-mock-127:/ifs/data/aaa/AccessZoneA:data-exfil-rwmr" # 00:00 Saturday
  - "0 0 1 * * 6:isi-mock-127:/ifs/data/aaa/AccessZoneA:data-exfil-rwmw" # 01:00 Saturday
  - "0 0 2 * * 6:isi-mock-127:/ifs/data/aaa/AccessZoneA:data-exfil-ml1" # 02:00 Saturday
  - "0 0 3 * * 6:isi-mock-127:/ifs/data/aaa/AccessZoneA:data-exfil-ml2" # 03:00 Saturday

training_delta_time:
  value: 48
  unit: "HOURS"
Apply the change:
./update_training_jobs.sh
The module now retrains every Saturday, staggered by model, with no further action required.
Installation Scripts
The automated installation includes two scripts for different purposes:
Installation Script (offline-installer.sh)
Run a complete installation of the threat hunting module with all components and dependencies:
./offline-installer.sh
This installation mode deploys:
- Complete ML model training infrastructure
- ClickHouse analytical database with optimized configurations
- PostgreSQL database for metadata and user management
- Superset dashboard interface with pre-configured threat hunting visualizations
- Kafka consumer services for real-time event processing
- Kubernetes deployment configurations for scalability and reliability
Full Installation Timeline:
- Initial setup and validation: 5-10 minutes
- Container image downloads: 15-30 minutes (depending on network speed)
- Database initialization and configuration: 10-15 minutes
- Service deployment and health checks: 5-10 minutes
- Total Expected Duration: 35-65 minutes
Training Configuration Update Script (update_training_jobs.sh)
Update ML training schedules and configurations without reinstalling the complete system:
./update_training_jobs.sh
Use this update mode to:
- Modify existing training schedules after initial deployment
- Add new data sources or training paths
- Adjust training frequency based on operational requirements
- Test new model configurations without full system reinstallation
Training Schedule Update Timeline:
- Configuration validation: 1-2 minutes
- Schedule deployment: 2-3 minutes
- Service restart and verification: 1-2 minutes
- Total Expected Duration: 5-10 minutes
After any installation mode completion, verify system functionality:
# Check all pods are running
kubectl -n seed-ml get pods

# Verify service connectivity
kubectl -n seed-ml get services

# Test dashboard accessibility
curl -k https://<threat-hunting-ip>:30443/health

# Check training job schedules
export KUBECONFIG=/etc/rancher/k3s/k3s.yaml
MLCORE_POD=$(kubectl -n seed-ml get pods | awk '/service-ml-core/ {print $1; exit}')

kubectl -n seed-ml logs "$MLCORE_POD" --since=24h \
| grep "MlTrainingSchedulerConfigurer : Zones:" | tail -n 1 \
| sed -e 's/^.*Zones: \[//' -e 's/\]$//' \
| sed 's/), /\),\n/g'

# View logs for services
kubectl -n seed-ml logs -f -l component=service-pipelines
Most important component labels for viewing logs:
service-pipelinesservice-inventoryservice-ml-coreml-data-exfiltration
Examples:
# View service-inventory logs
kubectl -n seed-ml logs -f -l component=service-inventory

# View service-ml-core logs
kubectl -n seed-ml logs -f -l component=service-ml-core

# View ml-data-exfiltration logs
kubectl -n seed-ml logs -f -l component=ml-data-exfiltration
For troubleshooting guidance specific to automated installation, including common configuration issues and diagnostic commands, see the Automated Installation Troubleshooting section in the main troubleshooting guide.