Threat Hunting Troubleshooting Guide
This guide provides useful tips and solutions for common issues encountered when working with the Threat Hunting module.
Tips
Adjust Alarm Frequency
Alarm RSW0034 is raised for anomalies with a confidence score of 75% or higher. To trigger alarms more frequently, lower the threshold. Update <confidence_score> in /opt/superna/sca/data/system.xml under <threat_hunting>, or run the following commands in Eyeglass:
igls config settings set --tag=confidence_score --value=65
sudo systemctl restart sca
Restart a Component
-
Get the pod name
kubectl -n seed-ml get pods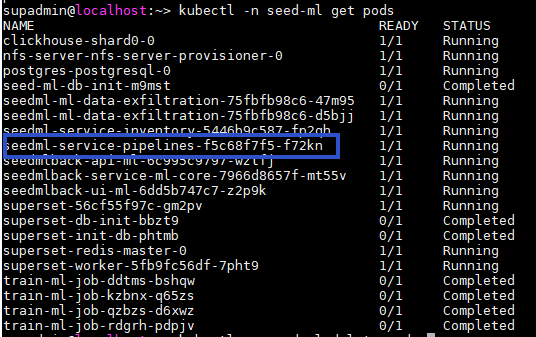
-
Delete the pod to restart it
kubectl -n seed-ml delete pod <component_name>tipKubernetes will automatically create a new pod to replace the deleted one, effectively restarting the component.
Check ML Module Server Logs
Logs are essential for diagnosing issues with the ML module components. Follow these steps to access logs:
-
List all pods to identify the component
kubectl -n seed-ml get pods -
View logs for a specific component
kubectl -n seed-ml logs <pod_name>
Update YAML Files and Restart Components
When you need to modify configuration for ML module components, follow these steps:
-
Update the YAML file with your required changes
-
Run the Helm upgrade command to apply changes:
helm upgrade --install <component_name> chart-seed-ml/charts/<component_name> -n seed-ml --create-namespace -f <component_name>-onprem-values.yamlExample for seedmlback:
helm upgrade --install seedmlback chart-seed-ml/charts/seedmlback -n seed-ml --create-namespace -f seedmlback-onprem-values.yaml -
Get the pod name, including ID:
kubectl -n seed-ml get pods -
Manually restart the component:
kubectl -n seed-ml delete pod <pod_name_with_id>Example:
kubectl -n seed-ml delete pod seedmlback-service-ml-core-7966d8657f-k4lrhtipKubernetes will automatically create a new pod with the updated configuration.
YAML File to Component Mapping:
For each YAML file update, restart the corresponding pods:
YAML File Components to Restart clickhouse-onprem-values.yaml
• clickhouseseedml-onprem-values.yaml
• ml-data-exfiltration
• inventory
• pipelinesseedmlback-onprem-values.yaml
• ui-ml
• api-ml
• service-ml-coresuperset-onprem-values.yaml
• superset
Troubleshooting
Kafka Topic Connection Failure
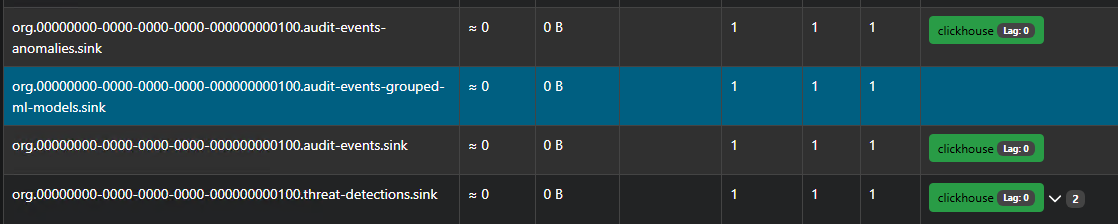
Issue: Kafka topic org.<tenant>.audit-events-grouped-ml-models.sink does not connect to data-pipelines-app
Solution:
Restart the seedml-service-pipelines component.
Helm Repository Timeout Error
Issue: Timeout error on adding bitnami to helm repo
Example Error:
helm repo add bitnami https://charts.bitnami.com/bitnami
Error: looks like "https://charts.bitnami.com/bitnami" is not a valid chart repository or cannot be reached: Get "https://charts.bitnami.com/bitnami/index.yaml": dial tcp: lookup charts.bitnami.com: i/o timeout
Solution:
Rerun the command. You may find it was actually added despite the error.
Example Success:
helm repo add bitnami https://charts.bitnami.com/bitnami
"bitnami" already exists with the same configuration, skipping
Regenerate ML Kafka Topics After ECA Upgrade
Issue: After upgrading ECA and restarting the cluster, ML Kafka topics need to be regenerated for proper communication between ECA and the ML module.
Solution:
Connect to your ML module server and restart the data pipelines:
kubectl -n seed-ml rollout restart deployment/seedml-service-pipelines
kubectl rollout status deployment/seedml-service-pipelines -n seed-ml
Kubernetes will automatically create a new pod to replace the deleted one, which will regenerate the necessary Kafka topics for proper communication with ECA.
First 60 Seconds
If Threat Hunting is not behaving as expected, run these three checks in order before going deeper:
| # | Check | How |
|---|---|---|
| 1 | Is Kafka reachable? | Probe each broker on port 9092 from the Threat Hunting VM. If all brokers succeed, the network path is fine. Anything else points to a firewall or routing issue. See Verify Kafka Connectivity. |
| 2 | Are the pods healthy? | Run kubectl get pods -n seed-ml and look for anything other than Running or Completed, such as CrashLoopBackOff, Pending, or ImagePullBackOff. |
| 3 | Is there an ACTIVE model for this path? | In the Threat Hunting interface, open the ML Training Jobs tab and look for your cluster and path showing Active and Ready. If nothing shows, training has not run or has failed. |
Threat Hunting Components
When a symptom points to a specific role, these are the components involved:
| Role | What it does |
|---|---|
| Kafka Streams | Reads audit events from Kafka, and groups them by user, path, and time window. |
| Inference | Loads trained models, scores each batch, and emits anomalies. |
| Databases | ClickHouse stores events and anomalies. PostgreSQL stores model metadata and the active model version. |
| API + UI | The backend API, the Threat Hunting interface, the training scheduler, and the model inventory service. |
| Shared storage | Serves the volume where the trained model files live. |
| Analytics | Apache Superset dashboards, separate from the Threat Hunting interface itself. |
Common Symptoms
Start from the symptom. Each row pairs a symptom with its most likely cause and the first thing to check:
| Symptom | Most likely cause | What to do |
|---|---|---|
| No anomalies appear at all | No ACTIVE model instance for that path, or the model files are missing | Check the ML Training Jobs tab for Active and Ready on that cluster and path. If training has not run or has failed, see Schedule the First Training Run. Also check the Jobs view and Superset dashboard 05 (Audit Events Overview). If dashboard 05 shows no events, the Kafka connection is not flowing: run the Kafka reachability check again and verify ML_MODULE_IP. |
| Detections stopped right after an Eyeglass or ECA update | The cluster and Kafka went down and came back up, and the pipeline did not reconnect automatically | Restart the pipeline deployment so that it re-establishes the Kafka connection. See Regenerate ML Kafka Topics After ECA Upgrade. |
| Events are flowing but routing looks stale | The active-instance cache has not refreshed yet | Wait a few minutes for the next refresh cycle, or restart the pipeline as described above. |
| A scheduled training run never produced a job | Training is disabled, or the Eyeglass connection or token is missing | Confirm that the Eyeglass token and appliance ID are correct and that training is enabled. |
| A training job keeps failing to start | ClickHouse is unreachable, or there is no audit data yet for that cluster and path | Confirm that ClickHouse has rows for that cluster and path prefix before retraining. |
| Every anomaly comes back low-confidence | The model trained on very little data | Let more real traffic accumulate before the next retrain. A very short training run is the usual sign. |
| The inference pod is stuck in CrashLoopBackOff | A stale NFS handle: the storage provisioner restarted while the pod still had a mount open | Run kubectl describe pod for the mount error, restart the NFS provisioner, then restart the inference deployment. |
| The dashboard returns HAProxy 502 or 503 errors | A backend pod is not ready yet: the volume is not mounted, or its readiness probe is still failing | Run kubectl get pods -n seed-ml and describe any pod stuck in Pending or not fully Ready. |
| All model files are gone and nothing detects anymore | The seed-ml namespace was deleted, which is not recoverable | Reinstall, and retrain all four models. Clean up any orphaned storage volumes first. |
Confirm That a Detection Landed
To confirm that a detection landed, query the audit_event_anomaly table in ClickHouse for recent anomalies, filtered to the last 30–60 minutes. Detections normally appear within about 5 minutes of the Kafka window closing. If a query like that comes back empty well past that window, check the routing cache next.
Ingestion Looks Broken: Kafka Hostname Resolution
Kafka broker hostnames are injected into the ClickHouse pod. If that resolution breaks, events stop landing even though Kafka itself is reachable. Find the ClickHouse pod, then confirm that each broker hostname resolves to an IP:
kubectl get pods -n seed-ml | grep clickhouse
# likely: clickhouse-shard0-0

kubectl exec clickhouse-shard0-0 -n seed-ml -- \
  getent hosts $(kubectl get pod clickhouse-shard0-0 -n seed-ml \
  -o jsonpath='{range .spec.hostAliases[*]}{.hostnames[0]} {end}')
Each hostname must print an IP. If one comes back silent, the hostAliases are missing or wrong. Check the Kafka entries in installer_vars.yaml and reinstall.
ClickHouse Disk Space
A disk alarm on the ClickHouse data path (/var/lib/rancher/k3s, default threshold 90%) warns that the database is running out of room. See alarm ML002. If you see slow queries or ingestion issues alongside a full-disk warning, check the usage with df -h /var/lib/rancher/k3s.
Automated Installation Troubleshooting
Common Configuration Issues
Empty Configuration Values
Empty IP addresses in the configuration file will cause installation failure.
Problem: Missing IP address values
ml_module:
  ip: ""
Solution: Add the actual IP address
ml_module:
  ip: "10.152.20.90"
Incomplete Kafka Configuration
All required Kafka configuration fields must be specified for successful installation.
Problem: Missing required Kafka fields
kafka:
  - ip: "10.152.1.148"
Solution: Include all required fields
kafka:
  - ip: "10.152.1.148"
    port: 9092
    hostname: "kafka.node1.jmseca1.eca.local"
Automated Installation Diagnostic Commands
Use these commands to diagnose automated installation and runtime issues:
Check Pod Status
kubectl -n seed-ml get pods
List Services
kubectl -n seed-ml get svc
Examine Pod Details
kubectl -n seed-ml describe pod <pod_name>
View Pod Logs
kubectl -n seed-ml logs <pod_name>
See Also
- Threat Hunting Installation - Go back to the main installation guide
- Automated Installation - Streamlined automated installation guide