Microsoft Sentinel Integration
Send Superna security alerts directly into Microsoft Sentinel for automated incident creation, correlation with other security signals, and unified SecOps response.
Support Statement
This documentation is provided "as is" without support for 3rd party software. The level of support for this integration guide is best effort without any SLA on response time. No 3rd party product support can be provided by Superna directly. 3rd party components require support contracts. See EULA for more details.
Overview
This integration enables customers to send Zero Trust alerts and Data Security events directly into Microsoft Sentinel, creating a unified security operations workflow. Detections from Superna's systems may relate to ransomware, threat hunting activities, or behavioral anomalies. They can also be based on custom rules, such as mass deletions or operations performed on specific paths. The exact detection logic depends on the features enabled and configured within the system. For ransomware detection, all required indicators are preconfigured by Superna and do not need to be recreated in the SIEM. Each payload contains the necessary details for the SecOps team to assess the event, conduct investigations, or build correlation rules with detections from other security systems.
Features and Solution Overview
This integration provides:
- Automated incident ingestion – Zero Trust alerts flow directly into Sentinel as structured incidents
- Rich alert context – Each incident includes user, client IP, shares, files, severity, and state information
- Correlation-ready data – Log Analytics tables enable KQL queries to correlate Superna alerts with identity events, endpoint telemetry, UEBA signals, and network logs
- Custom analytics rules – Build rules that trigger incidents based on severity thresholds, user behavior, or file path patterns
- SOC workflow integration – Incidents appear in Sentinel's unified queue for investigation, enrichment, and response
- Cloud-native architecture – No VMs or agents required; Logic Apps and Log Analytics handle all processing
Customer Workflow Benefits:
- Correlate Superna's storage-layer detections with other security systems
- Centralize all security incidents in a single pane of glass
- Reduce mean time to respond (MTTR) through automated incident creation
Limitations
- Requires Azure subscription with Log Analytics and Microsoft Sentinel configured
- Integration relies on Logic Apps for webhook ingestion
- Custom log tables incur Log Analytics ingestion and retention costs
- Analytics rules run on a scheduled basis (minimum 5-minute intervals)
About Microsoft Sentinel
Microsoft Sentinel is a cloud-native Security Information and Event Management (SIEM) and Security Orchestration, Automation, and Response (SOAR) solution. It provides intelligent security analytics and threat intelligence across the enterprise, offering a single solution for alert detection, threat visibility, proactive hunting, and threat response.
Integration Setup
Prerequisites
Before you begin, ensure you have:
Superna Requirements:
- Superna Data Security Edition version 2.13 or later (recommended for webhook testing)
- Active license/subscription for Zero Trust features
Azure Requirements:
- Active Azure subscription
- Microsoft Sentinel deployed and configured
- Log Analytics workspace attached to Sentinel
- Permissions to create and configure:
- Logic Apps
- Log Analytics workspaces
- Sentinel Analytics Rules
Credentials:
- Azure subscription ID
- Log Analytics workspace ID
- Log Analytics primary key
- Logic App workflow endpoint URL (generated during configuration)
Network Connectivity:
- Superna system must be able to reach Azure Logic Apps endpoints (HTTPS/443)
- No inbound firewall rules required
- Outbound HTTPS connectivity to
*.azure.comdomains
Configuration
Step 1: Configure Azure Log Analytics Workspace
Find the Workspace ID
-
In the Azure Portal, search for Log Analytics workspaces in the navigation bar.
-
Select your workspace (create a new one if needed).
Creating a new workspaceThere is no need to go through all the configuration options — you can click Review + Create on the first step to accept the defaults and provision the workspace immediately.
-
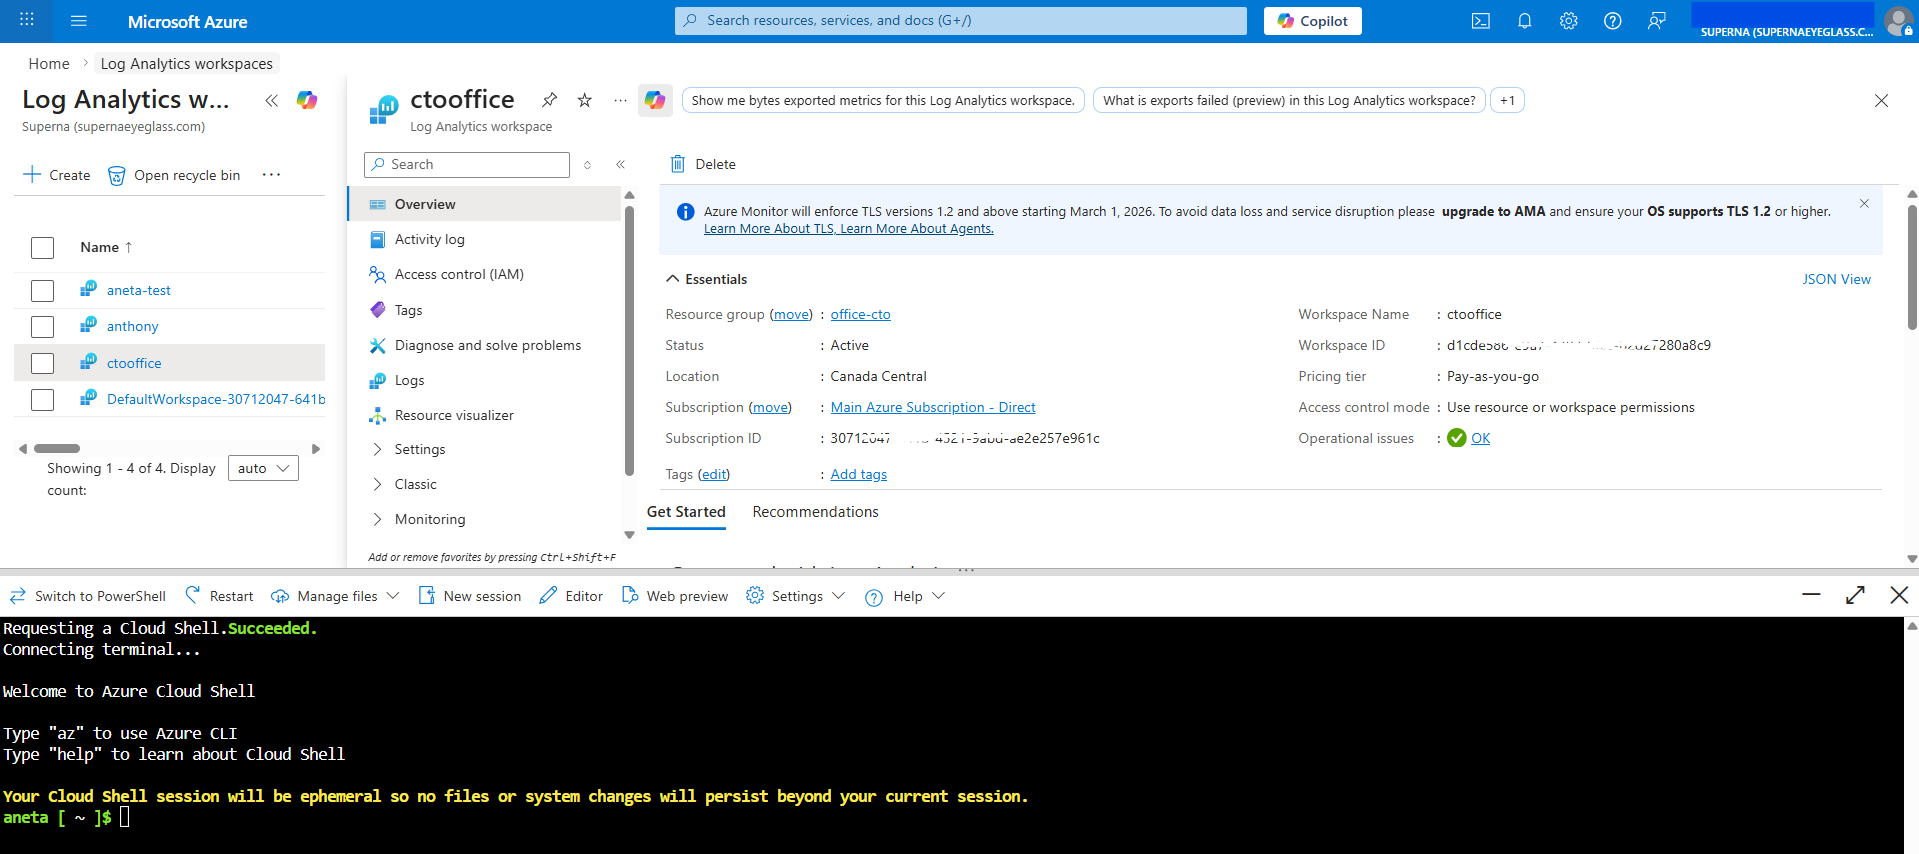
Click the Overview tab.
-
Record the Workspace ID displayed on this page — you will need it in later steps.
Find the Primary Key
The Primary Key may not be visible in all Azure Portal UI versions. Use one of the two methods below to retrieve it.
Method 1 – Azure Portal (Settings > Agents)
The Agents section may still show the key in some tenants. If available:
- In your Log Analytics workspace, go to Settings → Agents in the left navigation menu.
- Expand the Log Analytics agent instructions section by clicking the arrow/chevron.
- Record the Primary Key shown under the key fields.
If the key is not visible here, use Method 2 below.
Method 2 – Azure Cloud Shell (Recommended)
This method works regardless of portal UI variations and is the most reliable way to retrieve the key:
-
In the Azure Portal, click the Cloud Shell icon (top toolbar) and select Bash.

-
Run the following commands, replacing the placeholder values with your own:
   az account set --subscription <your-subscription-id>
   az monitor log-analytics workspace get-shared-keys \
     --resource-group <your-resource-group> \
     --workspace-name <your-workspace-name> \
--query "primarySharedKey" -
Record the
primarySharedKeyvalue returned — this is your Primary Key.
You can find your subscription ID, resource group, and workspace name on the Overview page of your Log Analytics workspace in the Azure Portal.
Step 2: Create Logic App with HTTP Trigger
Create a Logic App workflow that receives webhooks from Superna and forwards them to Sentinel Log Analytics.
Create the Logic App
-
In Azure Portal, navigate to Logic Apps
-
Click Add to create a new Logic App
-
Provide a descriptive name (e.g.,
superna-detections) -
Select your resource group and region
-
Create the Logic App with default settings
noteWhen creating the Logic App, select the default option and click Review + Create right away — there is no need to go through all the other configuration tabs. The provisioning process can take a few minutes to complete.
-
Once created, click Go to resource
Configure the Workflow
- Click the Workflows tab
- Click Add to create a new workflow
- Select the Designer option
- Click Add Trigger
- Search for HTTP and select the When a HTTP request is received trigger
Add Log Analytics Data Collector Action
-
Click the + sign to add another step to the workflow
-
Search for Azure Log and select Azure Log Analytics Data Collector - Send Data
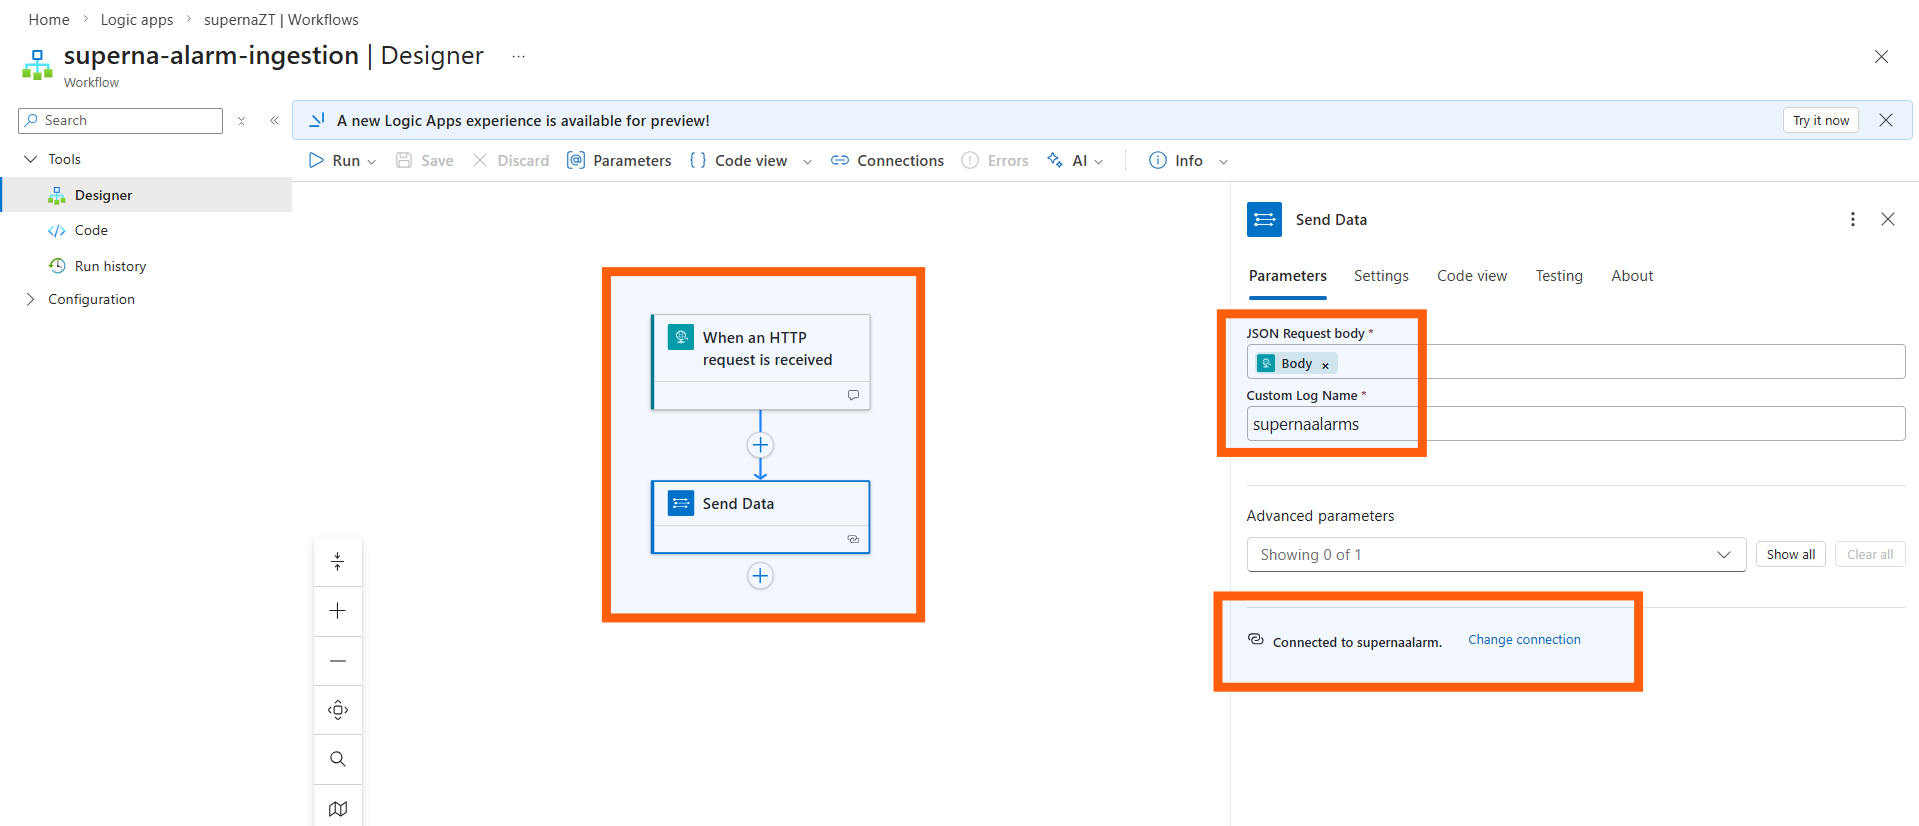
-
After adding the Send Data action, go to Parameters → Change connection. At the bottom of the section, click Add new and enter the credentials collected in Step 1:
- Workspace ID: Enter your Log Analytics workspace ID
- Workspace Key: Enter the primary key from Step 1 (note: Workspace Key = Primary Key)
Connection namingEdit the connection name to match the custom log name you plan to use (e.g.,
superna-detections). This makes it easier to identify the connection later. -
Click in the JSON Request Body field and click the lightning bolt icon
-
Select the Body option from dynamic content
-
Enter a name for the collector in the Custom Log Name field
The name you enter here will be the name of the log table created in Sentinel Custom Logs section (e.g., superna-detections will create a table named superna-detections_CL).
Generate the Endpoint URL
- Click Save to save the workflow
- Click on the workflow name to view details
- Use the Copy URL option to record the endpoint URL
- Save this URL for configuration in Superna Data Security Edition
Step 3: Configure Superna Zero Trust Webhooks
For Data Security Edition (Zero Trust)
Configure the webhook endpoint in Superna Data Security Edition to send alerts to the Logic App.
-
Log in to Superna Data Security Edition web interface
-
Navigate to Integrations → Webhooks
-
Click Add Webhook or edit an existing webhook configuration
-
Configure the webhook:
- Endpoint URL: Paste the Logic App workflow URL from Step 2
- Headers: Add
Content-Typewith valueapplication/json - Filters: Select event types and severities to send
Recommended Configuration:
- Severities: Critical and Major events only
- Events: Webhooks that set lockout or delayed lockout
- Goal: Send findings versus a list of alarms that do not pinpoint a security incident
noteThe event severities generated depend on the Superna operating mode:
- In Enforcement mode, only Critical and Major events are generated.
- In Monitor mode, Warning events are generated.
-
Click Save to commit the webhook configuration
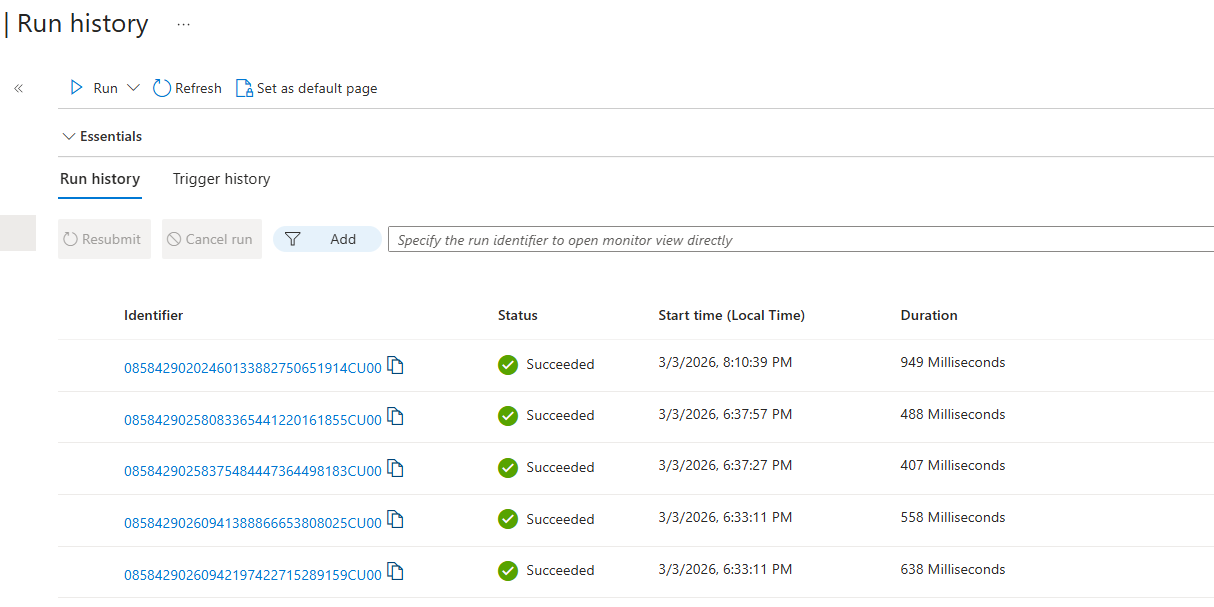
For Superna Data Security Edition version 2.13 and later:
- Click the Test Webhooks button in the GUI
- Verify that HTTP response code 201 or 200 is returned
- Any other response indicates a configuration issue
For earlier versions (pre-2.13), send a sample webhook payload manually using curl or a similar tool to verify connectivity. You can use the sample curl template.
Step 4: Verify Log Data in Sentinel
Before verifying logs, associate the Log Analytics workspace with Microsoft Sentinel.
-
In the Azure Portal, navigate to Microsoft Sentinel
-
Click + Add to add a workspace
-
Select the Log Analytics workspace you created in Step 1
-
Click Add Microsoft Sentinel to complete the association
Once the workspace is connected, continue with the following steps to verify that alert data has arrived:
-
Select your Sentinel workspace
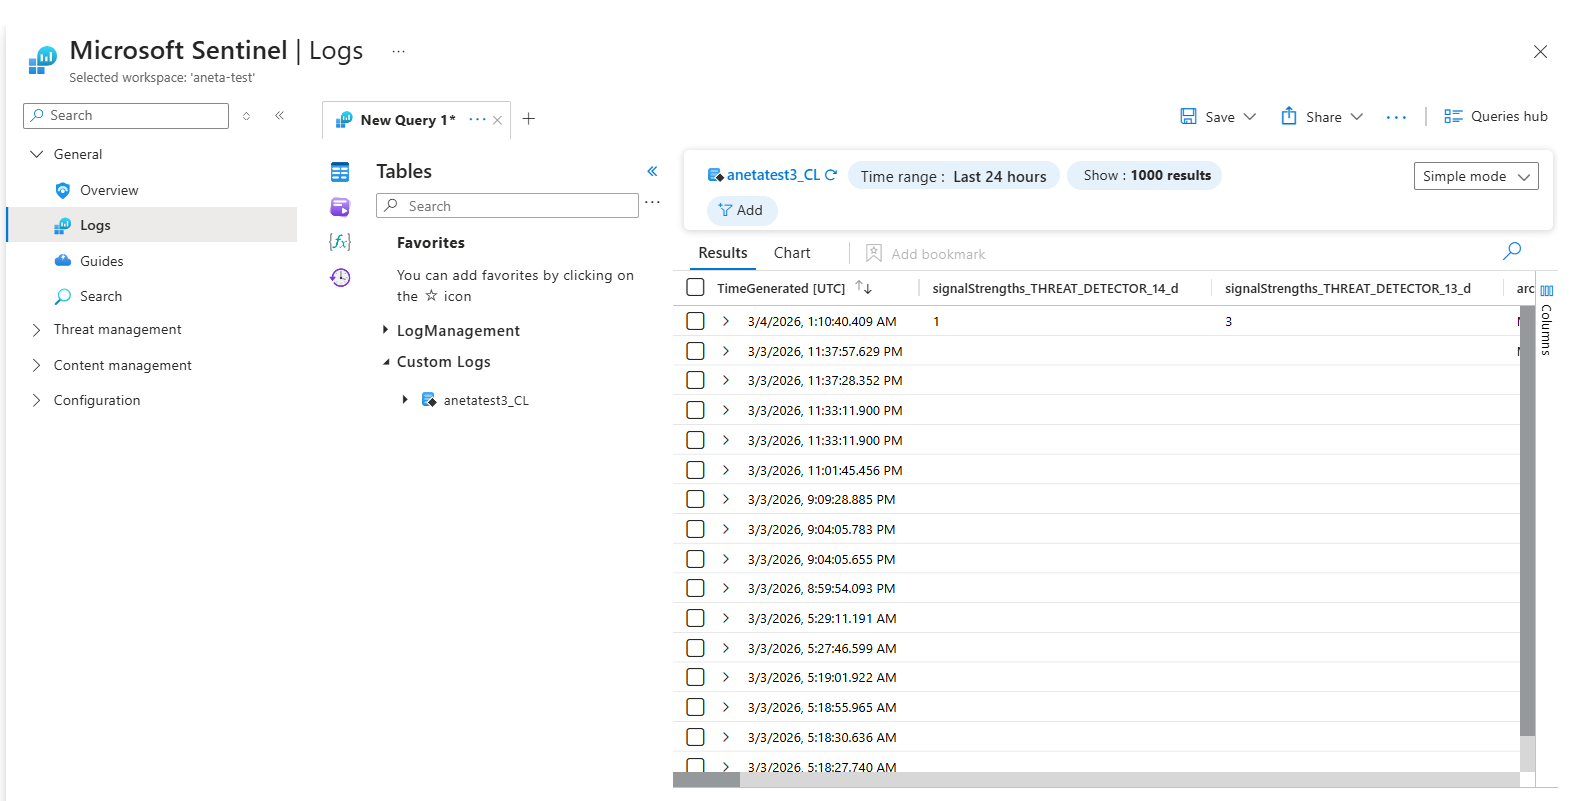
-
Click Logs in the left navigation
-
Click the Tables icon to expand the view
-
Expand Custom Logs
-
Look for the log table name you created in the Logic App (e.g.,
superna-detections_CL)
The custom log table is created automatically when the first event is received from Superna. If you don't see the table, ensure you've sent a test webhook.
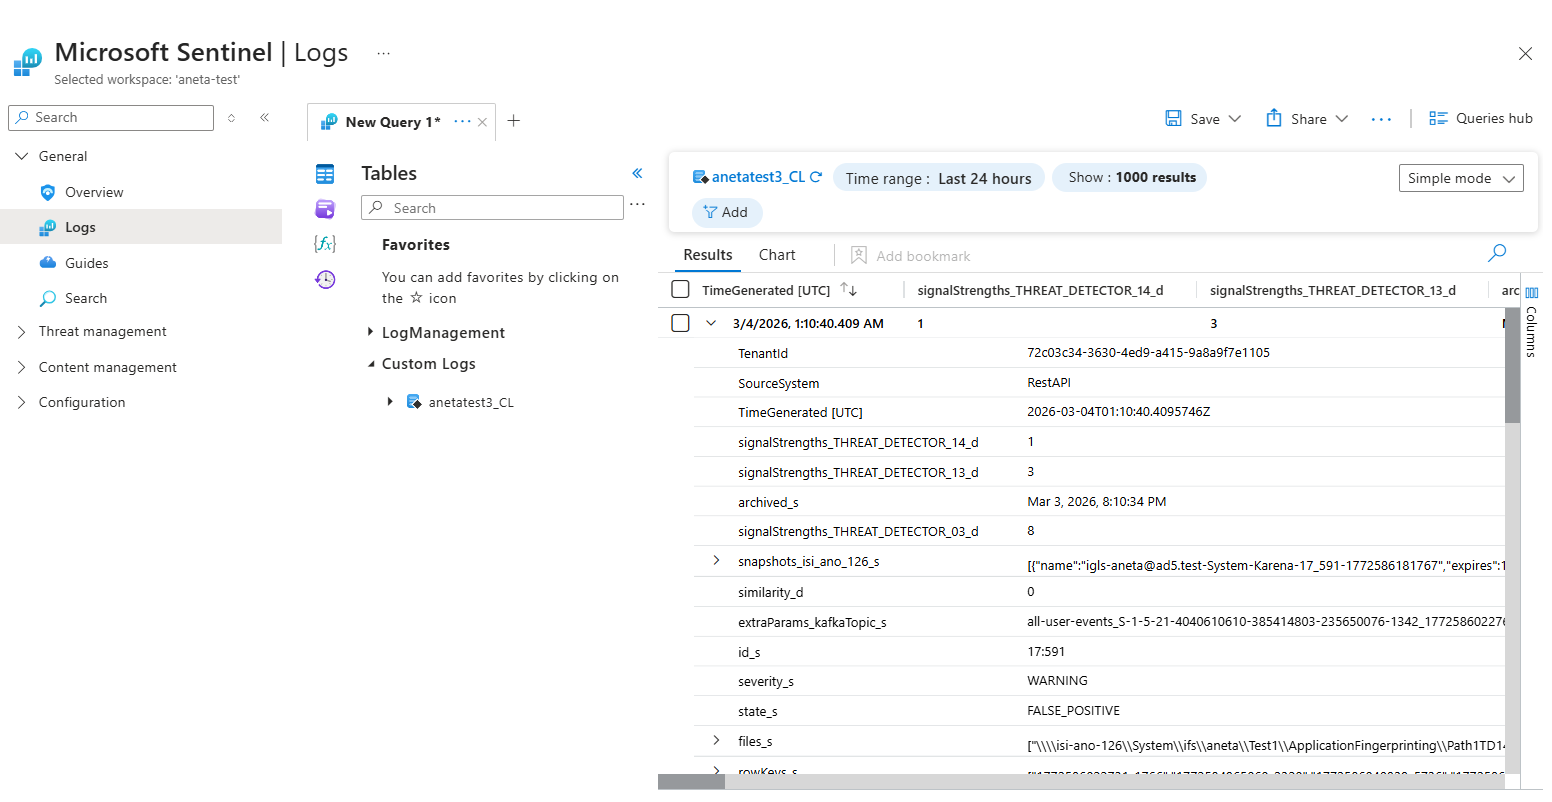
Query the Log Data
- Double-click the table name to add it to the query editor
- Click Run to execute the query
- Expand an entry to see the full payload of the alert
Example fields included:
severity_s– Alert severity (CRITICAL, MAJOR, WARNING, etc.)state_s– Alert state (LOCKED_OUT, DELAYED_LOCKOUT, etc.)user_s– Active Directory user nameclientIPs_s– Client IP addressesshares_s– SMB shares affectedfiles_s– List of files involved
Step 5: Create Sentinel Analytics Rules
The steps in this section are being reviewed and updated to align with the current Microsoft Sentinel UI. Some screen labels or navigation paths may differ from what is shown here. The KQL query below is accurate; the configuration steps will be updated shortly.
Create analytics rules that use the log data to automatically generate Security Incidents.
Build the KQL Query
- In Sentinel, navigate to Logs
- Build a query to detect events that should trigger incidents
Example query (assumes log table name is
superna-detections_CL):This query searches for critical alerts with a lockout state. You can create triggers using any available fields in the Zero Trust alarm data.superna-detections_CL
| where severity_s contains "CRITICAL" and state_s contains "LOCKED_OUT" - Run the query to verify it returns the expected results
- Click + New alert rule and select Create Microsoft Sentinel alert
Configure the Analytics Rule
-
General tab:
- Name: Descriptive name (e.g., "Superna Critical Lockout Detection")
- Description: Explain what this rule detects
- Tactics and Techniques: Select MITRE ATT&CK tactics
- Recommended: Impact, Collection, Exfiltration
- Severity: Match the alert severity (Critical, High, Medium, Low)
-
Set rule logic tab:
- The query is pre-populated from the previous step
- Alert enrichment: Add custom details to map fields to incident properties
Recommended Entity Mappings:
Display Name Field Name Severity severity_sState state_sUser user_sClient IPs clientIPs_sShares shares_sFiles files_s -
Query scheduling:
- Run query every: 5 minutes (recommended minimum)
- Lookup data from the last: 5 minutes
-
Alert threshold:
- Generate alert when number of query results: is greater than 0
-
Event grouping:
- Select Group all events into a single alert (recommended)
-
Suppression: Configure if needed (typically off for security alerts)
-
Incident settings tab:
- Create incidents: Enabled
- Alert grouping: Configure based on your preferences
-
Automated response tab:
- Add any playbooks or automation rules if configured
-
Click Review + create to create the analytics rule
Create Additional Rules
Repeat the analytics rule creation process for different scenarios:
- Major severity alerts
- Delayed lockout states
- Specific user or share patterns
- File path-based detections
SecOps Administrator Integration Experience
What to Expect
When the integration is complete, SecOps administrators will see:
Sentinel Incidents
- Incidents appear in the Microsoft Sentinel Incidents queue
- Each incident contains:
- Title: Based on analytics rule name
- Severity: Inherited from Superna alert
- Status: New (initially)
- Custom details: User, IPs, shares, files, state
- Related entities: Extracted from alert payload
Investigation Workflow
- Review incident in Sentinel Incidents view
- Examine custom details for context:
- Which user triggered the alert?
- What client IP addresses were involved?
- Which shares and files were affected?
- What is the current state (locked out, delayed lockout)?
- Correlate with other signals:
- Pivot to Defender XDR for endpoint context
- Check Azure AD/Entra ID logs for authentication events
- Review network logs for lateral movement
- Take action:
- Run automated playbooks (if configured)
- Manually investigate the user or host
- Escalate to Tier 2/3 if needed
- Close the incident after remediation
Recommended Playbooks (SOAR)
Consider configuring Sentinel playbooks that:
- Lock out risky users via Superna Zero Trust API
- Create snapshots of critical data stores
- Send notifications to SecOps email or Teams
- Enrich incidents with AD user details or host information
- Update ITSM tickets (ServiceNow, Jira) automatically
Architecture Diagram / Flow
Troubleshooting
Useful Commands
Azure CLI: Check Log Analytics Ingestion�
# List recent custom log entries
az monitor log-analytics query \
  --workspace <workspace-id> \
  --analytics-query "superna-detections_CL | take 10" \
  --output table
PowerShell: Test Logic App Endpoint
$headers = @{ "Content-Type" = "application/json" }
$body = @{
  severity = "CRITICAL"
  state = "LOCKED_OUT"
  user = "testuser"
  clientIPs = @("192.168.1.100")
} | ConvertTo-Json
Invoke-RestMethod -Uri "https://your-logic-app-url" -Method Post -Headers $headers -Body $body
Common Misconfigurations
| Issue | Cause | Solution |
|---|---|---|
| Logic App returns 400 Bad Request | Missing Content-Type header | Add Content-Type: application/json to webhook configuration |
| Custom log table not appearing | No events sent yet | Send a test webhook to trigger table creation |
| Analytics rule not creating incidents | Query returns no results | Verify query filters match actual log data |
| Webhook returns 500 error | Logic App misconfigured | Check Logic App run history for errors |
Debugging Steps
- Verify webhook connectivity:
- Use Superna's test webhook feature (v2.13+)
- Check for HTTP 200/201 response
- Review Logic App run history for errors
- Check Log Analytics ingestion:
- Query the custom log table directly
- Verify data is arriving with expected fields
- Check for ingestion delays (typically < 5 minutes)
- Validate Analytics Rules:
- Run the KQL query manually to verify results
- Check analytics rule run history
- Ensure rule is enabled and scheduled correctly
- Review incident creation:
- Check Sentinel Incidents view
- Verify incident settings (grouping, severity)
- Review any suppression rules that may block incident creation
FAQs
Do I need to deploy any VM or runtime?
No—this integration is entirely cloud-native for Data Security Edition. Logic Apps handle ingestion, and Log Analytics stores the alert data.
What table do Zero Trust alerts land in?
A custom table such as superna-detections_CL (or the name you specified) is created in your Log Analytics workspace. All Superna fields are stored as columns or JSON.
How do I create a Sentinel Incident?
You configure a Sentinel Analytics Rule using a KQL query that inspects your custom log table for severity thresholds or Zero Trust alert types.
Can I enrich incidents with Defender XDR?
Yes—Sentinel correlates Superna's storage-layer alerts with identity events, host telemetry, UEBA signals, and any other logs in your workspace.
Can I test the integration?
Yes—Superna can send a test event (v2.13+). It should appear in Log Analytics → Logs and then trigger the Analytics Rule to create a Sentinel Incident.
What versions of Superna are supported?
Data Security Edition 2.13 or later is recommended for the webhook testing feature. Earlier versions are supported but require manual testing.
How much does Log Analytics ingestion cost?
Azure Log Analytics charges based on data ingestion volume and retention. Superna webhooks are typically small (< 5KB per event). Review Azure pricing for current rates.
Can I filter which events are sent to Sentinel?
Yes—configure webhook filters in Superna to only send Critical/Major events, or events matching specific criteria. This reduces noise and Log Analytics costs.
How long is log data retained?
Log Analytics retention is configurable per workspace. Default is 30 days, but can be extended up to 730 days with additional costs.
Can I run playbooks automatically when incidents are created?
Yes—configure automated response in the Analytics Rule or create Automation Rules in Sentinel to trigger playbooks based on incident properties.