Automated Installation
The automated installation service provides a streamlined approach to deploying the threat hunting module with simplified configuration and reduced manual steps.
Before starting the automated installation, review the system requirements and gather the necessary configuration details in the Before You Begin section.
Superna Kubernetes OVF Setup
-
Download the Superna Kubernetes OVF from the Superna software downloads page.
-
Deploy the OVF through VMware vCenter and fill in the fields in the Customize Template step as shown in the table below.
Field Description Data disk size Defines the size of the data disk in gigabytes (GB). The minimum recommended value is 200 GB. Create Data Disk Filesystem Enables the automatic creation of the data disk filesystem during deployment. Node FQDN Specifies the fully qualified domain name (FQDN) for the node. Use only alphanumeric characters, dots ( .), and hyphens (-).ens160 Default Gateway Sets the default gateway for the network interface. ens160 Netmask Defines the subnet mask for the network interface. DNS Lists the DNS IP addresses, separated by spaces. NTP Servers Lists the NTP servers used for time synchronization, separated by spaces. Domain Search List Lists domain names used for internal hostname resolution. ens160 IP Assigns the IP address for the network interface.
Default VM Credentials
After deploying and powering on the virtual machine, access the system using the default credentials below:
- Username: superna
- Password: hyp3r10n!
For security reasons, change the default password immediately after first login.
Installation Process
Configure ECA Nodes for Kafka Connection
Configure firewall rules to allow the threat hunting module host to connect to ECA Kafka services.
-
Connect to ECA node 1 using SSH with the ecaadmin user credentials.
-
Stop the cluster:
ecactl cluster down -
Open the firewall configuration file:
nano /opt/superna/eca/scripts/eca_iptables.sh -
Add the following line under rule #5. Replace
x.x.x.xwith your threat hunting module host IP address:# Allow Kafka access from threat hunting module
sudo /usr/sbin/iptables -A $CHAIN -p tcp --dport 9092 -s x.x.x.x -j ACCEPT -
Save the file and exit the editor (Ctrl+X in nano).
-
Apply the firewall changes by restarting the cluster:
ecactl cluster up -
Confirm the firewall rule exists on all ECA nodes in your cluster.
Prepare Eyeglass to Rotate ML Module Logs
-
SSH to Eyeglass server as admin user.
-
Append the following content to the file
/etc/logrotate.d/eca-syslog-logrotate.conf:# Threat Hunting logrotate configuration
/opt/superna/eca/logs/ml-cluster_1/*.log {
maxsize 50M
rotate 1
daily
dateformat -%Y%m%d-%H%M
missingok
sharedscripts # Run the script below once per rotate, not once per log
prerotate
# Remove files and folders older than 48h (2880 minutes)
find /opt/superna/eca/logs/ml-cluster_1/ -mindepth 1 -depth -mmin +2880 -exec rm -rf {} + 2>/dev/null || true
endscript
}
The following steps must be performed on the ML machine.
Download and Run the Installer
-
Download the installer from the Superna software downloads page https://support.superna.net
noteAfter downloading the Threat Hunting installer, create a folder
/opt/superna/th-moduleand copy the installer there. -
Unzip the installer and run it to extract the offline package:
chmod +x thm-<LATEST_VER>.run
./thm-<LATEST_VER>.run
If zypper fails to install packages, run these commands and try the installation again:
# See repos (note the repo name and number)
sudo zypper lr -u
# Disable the CD/DVD repo by NAME (preferred)
sudo zypper mr -d 'openSUSE-Leap-15.6-1'
# or disable by NUMBER if it's, say, 1
sudo zypper mr -d 1
# Refresh again
sudo zypper ref
Configure Installation
Update the installer_vars.yaml file with your environment-specific values before running the installation script. This configuration file contains all the parameters needed for your specific deployment environment.
Configuration File Structure
The installer_vars.yaml file is structured into logical sections, each containing related configuration parameters. All parameters include detailed comments explaining their purpose and how to obtain the correct values.
File Location:
th-module/
├── airgap_installer.sh
├── installer_vars.yaml          # ← Main configuration file
└── .installation/               # Generated during installation (temporary files)
Required Configuration Steps
-
Navigate to the configuration file:
nano installer_vars.yaml -
Update the following required sections with your environment-specific values:
ML Module Configuration
# ========================================
# ML Module Configuration
# ========================================
ml_module:
  # IP address where the ML module services will be accessible
  # This should be the IP of your VM
  ip: "YOUR_ML_MODULE_IP"
Required Information:
- ML Module IP: The IP address of the OpenSUSE server/VM where the ML module will be installed
- How to obtain: Contact your network administrator or check the server's network configuration with
ip addr showorifconfig.
Eyeglass Integration Configuration
# ========================================
# Eyeglass Integration Configuration
# ========================================
eyeglass:
  # Eyeglass server IP address for integration
  ip: "YOUR_EYEGLASS_IP"

  # Public key for Eyeglass authentication (value of the eca node file /opt/superna/eca/data/common/.secure/rsa/isilon.pub)
  public_key: "YOUR_ECA_PUBLIC_KEY"

  # Sera token from Eyeglass UI - Integrations - Api Tokens
  token: "YOUR_EYEGLASS_TOKEN"

  # Appliance ID from Eyeglass for platform identification
  # To get this value, open a shell to the Eyeglass VM and run:
  # igls admin appid
  appliance: "YOUR_APPLIANCE_ID"
Required Information:
- Eyeglass IP: IP address of your Eyeglass server. Replace the placeholder/empty value.
- Public Key: ECA connection key. Replace the placeholder/empty value. Paste as a single line string. Do not include the separators BEGIN/END PUBLIC KEY. Example:
public_key: "ssh-rsa AAAAB3NzaC1yc2EAAAADAQABAAABAQ...==". - Sera Token: Eyeglass access API. Replace the placeholder/empty value.
- Appliance: Eyeglass Unique App ID. Replace the placeholder/empty value.
Release and Version Configuration
# ========================================
# Release and Version Configuration
# ========================================
# Version of SEED ML platform to install
release: "1.1.1"
Update to the version to be installed.
Database Configuration
# ========================================
# Database Configuration
# ========================================
# ClickHouse database password for analytics data
clickhouse_pass: "Clickhouse.Change-me.2025"
# PostgreSQL admin password for application data
postgres_admin_pass: "Postgres.Change-me.2025"
# Apache Superset admin user password for dashboards
superset_admin_user_pass: "Superset.Change-me.2025"
# Superset secret key for session encryption
superset_secret_key: "Change-it-2024"
Security Requirements:
- Change all default passwords - Never use the example passwords in production
- Use strong passwords with mixed case, numbers, and special characters
- Minimum 12 characters recommended
- Store passwords securely and restrict access to configuration file
Kafka Cluster Configuration
# ========================================
# Kafka Cluster Configuration
# ========================================
# List of Kafka brokers. Corresponds to the ips and names of all eca clusters.
# To get this info, login to eca node 1 and run: ecactl cluster exec docker exec kafka cat ./config/server.properties | grep listeners=
kafka:
  - ip: "YOUR_ECA_NODE1_IP"
    port: 9092
    hostname: "YOUR_ECA_NODE1_HOSTNAME"
  - ip: "YOUR_ECA_NODE2_IP"
    port: 9092
    hostname: "YOUR_ECA_NODE2_HOSTNAME"
Required Information for Each Kafka Node:
- IP Address: Network IP address of the Kafka broker
- Port: Kafka broker port (standard: 9092)
- Hostname: Fully qualified domain name of the Kafka node
How to obtain Kafka brokers configuration:
- Connect to ECA Node: SSH to ECA node 1 as ecaadmin
- Get kafka brokers information: Run:
ecactl cluster exec docker exec kafka cat ./config/server.properties | grep listeners=to get kafka brokers ip and hostname
noteYou will see something like
ecaadmin@jmseca1-1:~> ecactl cluster exec docker exec kafka cat ./config/server.properties | grep listeners=
#advertised.listeners=PLAINTEXT://your.host.name:9092
listeners=PLAINTEXT://kafka.node1.jmseca1.eca.local:9092
Connection to 10.152.1.148 closed.
# advertised.listeners=PLAINTEXT://your.host.name:9092
listeners=PLAINTEXT://kafka.node2.jmseca1.eca.local:9092
Connection to 10.152.1.149 closed.
# advertised.listeners=PLAINTEXT://your.host.name:9092
listeners=PLAINTEXT://kafka.node3.jmseca1.eca.local:9092
Connection to 10.152.1.150 closed.
Example with multiple nodes:
kafka:
  - ip: "10.152.1.148"
    port: 9092
    hostname: "kafka.node1.jmseca1.eca.local"
  - ip: "10.152.1.149"
    port: 9092
    hostname: "kafka.node2.jmseca1.eca.local"
Network Requirements:
- Ensure firewall rules allow ML module to connect to port 9092 on all Kafka nodes. This is done in the first step of this manual.
- Verify DNS resolution for Kafka hostnames from ML module server
Training Delta Time Configuration
Time offset to apply when training ML models:
# ========================================
# Training Delta Time Configuration
# ========================================
# Time offset to apply when training ML models
# This defines how far back in time to fetch training data from the current moment
# Example: value=48, unit=HOURS means training will use data up to 2 days ago
training_delta_time:
  # Numeric value for the time offset (e.g., 48 for 2 days when unit is HOURS)
  value: 48
  # Time unit for the offset value
  # Valid values based on Java ChronoUnit (MINUTES, HOURS, DAYS, WEEKS, MONTHS, YEARS)
  unit: "HOURS"
Allowed Paths Configuration
Filter paths to be processed by the Kafka pipeline based on file path patterns. Default value empty to process all events:
pipelines:
  # Filter paths to be processed by the Kafka pipeline based on file path patterns.
  # If not specified or empty, all paths received by the ML module will be processed.
  # Supports glob patterns for flexible path matching.
  # Examples:
  #   - "**/data/**"
  #   - "/example/test*"
  allowed-paths:
    - "**/data/**"
Denied Extensions Configuration
File extensions to exclude from processing:
pipelines:
  # File extensions to exclude from processing by the ML module.
  # These transitory and temporary file extensions are denied by default.
  # Adjust according to client requirements and environment specifics.
  denied-extensions:
    - ".tmp"
    - ".crdownload"
    - ".log"
    - ".part"
    - ".ismv"
    - ".isma"
    - ".bak"
    - ".zip"
    - ".bin"
    - ".nfs*"
Replica Configuration
Internal configuration for Kafka pipeline replicas. Internal configuration to be changed when kafka partitions are higher than default value (9). Do not touch if unsure:
pipelines:
  # Replica configuration for the Kafka pipeline service in the Kubernetes cluster
  # The number of replicas depends on the number of partitions in the 'eyeglassevents' Kafka topic
  # Default: 4 replicas for 9 partitions (default topic configuration)
  # Increase the replica count proportionally if the number of topic partitions is increased
  replicas: 4
UI Authentication Configuration
Define the username and password for the basic UI authentication:
# ========================================
# API Configuration
# ========================================
http-access:
  # Basic authentication configuration
  # Used as fallback authentication when an Eyeglass session cookie is not present in the request
  # Username for basic authentication
  user: mladmin
  # Bcrypt-hashed password for basic authentication. Default value: 3y3gl4ss
  # IMPORTANT: Password must start with {bcrypt} prefix (required by Spring Boot)
  # To generate a new password hash, use: htpasswd -bnBC 12 "" your_password. Then prepend {bcrypt} to the generated hash
  password: "{bcrypt}$2y$12$cYeF5PiZedpKxzh5NnRxy.agU9COzJc/NphibEXpjmO8dl9sZ4vw."
Training Scheduler Configuration
warningPay attention to the cron expression format, which must include seconds, so it has 6 elements, and is evaluated in UTC timezone
# ========================================
# Training Scheduler Configuration
# ========================================
# Cron-based scheduling for ML training jobs
# Format: "<cron_expression>:<cluster_name>:<path>:<model_name>"
#
# Cron format: "second minute hour day month day_of_week"
# Examples:
#   "0 0 2 * * 6" = Every Saturday at 02:00:00
#   "0 30 14 * * 1-5" = Every weekday at 14:30:00
#
# Support team: Modify these schedules as needed for your environment
training_scheduler:
- "0 0 0 * * 6:isi-mock-127:/ifs/data/aaa/AccessZoneA:data-exfil-rwmr" # 00:00 Saturday
- "0 0 1 * * 6:isi-mock-127:/ifs/data/aaa/AccessZoneA:data-exfil-rwmw" # 01:00 Saturday
- "0 0 2 * * 6:isi-mock-127:/ifs/data/aaa/AccessZoneA:data-exfil-ml1" # 02:00 Saturday
- "0 0 3 * * 6:isi-mock-127:/ifs/data/aaa/AccessZoneA:data-exfil-ml2" # 03:00 Saturday
Format Explanation:
- Cron Expression:
"0 0 0 * * 6"= Every Saturday at midnight (00:00:00) - Cluster Name: Isilon cluster name (e.g., isi-mock-127)
noteHow to obtain This information is available in the Inventory Icon listing the the cluster name
-
Path: The full path to the area in the file system that you want to monitor for Data Exfiltration attempts
-
Model Name: Identifier for the training job type (e.g., data-exfil-rwmr). If you set this value empty then all 4 models will be trained.
Cron Format Details:
Field Allowed values Special characters Second 0-59 */,-Minute 0-59 */,-Hour 0-23 */,-Day of month 1-31 */,-?Month 1-12 or JAN-DEC */,-Day of week 0-6 or SUN-SAT */,-?Common Cron Examples:
-
"0 0 2 * * 6"= Every Saturday at 02:00:00 -
"0 30 14 * * 1-5"= Every weekday at 14:30:00 -
"0 0 */6 * * *"= Every 6 hours -
"0 0 0 1 * *"= First day of every month at midnight
Security Requirements- Never use default passwords in production
- Change all example passwords before installation
- Use strong passwords with mixed case, numbers, and special characters
- Minimum 12 characters recommended
- Never commit passwords to version control
-
Save file and exit
Execute Installation
-
Make the installer script executable:
chmod +x airgap_installer.sh -
Run the installation script. The installation process will prompt for several inputs:
./airgap_installer.shInstallation Prompts and Responses
During the installation, you'll be prompted for a few key pieces of information. Follow the recommended responses to ensure a smooth setup.
-
Configuration Validation
The script will automatically validate your installer_vars.yaml file. If any required fields are missing or invalid, you'll see errors like:
ERROR: Missing required field: ml_module.ip in installer_vars.yamlResponse: Stop the installation (Ctrl+C), fix the configuration file, and restart the installation.
Installation Progress Indicators:
During installation, you'll see progress messages like:
- "Running full installation..."
- "Adding repositories needed and updating them"
- "Building dependencies for clickhouse"
-
-
Confirm all pods are running successfully:
kubectl -n seed-ml get pods
Access Superset Dashboard
Importing these dashboards is optional for the module's core functionality, but it is highly recommended as they contain valuable tools for analyzing various threat huntings.
After installation completion, access the Superset dashboard using your threat hunting module IP address:
https://<THREAT_HUNTING_MODULE_IP>:30443/
Replace <THREAT_HUNTING_MODULE_IP> with your actual threat hunting module server IP address: ip addr show.
Import Dashboards
-
In the Superset dashboard, locate and select the Import button in the upper-right corner of the interface, as indicated by the icon below.

-
Copy the dashboard configuration files to your local machine. You can extract them directly from the Threat Hunting installer if it is already downloaded locally, or copy them from the installation directory on the Threat Hunting module host:
scp <user>@<THREAT_HUNTING_MODULE_IP>:<installation-path>/chart-seed-ml/charts/superset/resources/*.zip /local/destination/ -
Upload the dashboard files through the Superset import interface. Enter the database passwords you configured during installation when prompted.
-
Configure the ML_Model_Instances dataset with your environment-specific settings:
-
Open Dataset Configuration
Navigate to Datasets > ML_Model_Instances
-
Update IP Address
Update the IP address field with your threat hunting module IP address
-
Configure Service URL
Modify the service URL to match your environment:
https://<THREAT_HUNTING_MODULE_IP>:31443/prod/ml-data-exfiltration/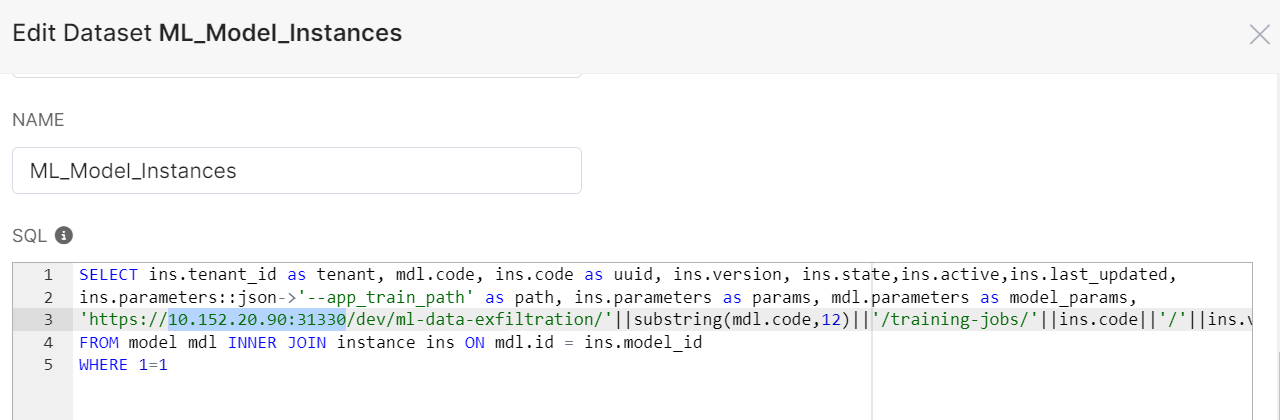
-
Enable Threat Hunting Module in Eyeglass
-
Use SSH to connect to the SCA VM with administrator credentials.
-
Open the system configuration file:
nano /opt/superna/sca/conf/system.xml -
Locate the
<th_enabled>parameter and set its value totrue:<th_enabled>true</th_enabled> -
Apply the configuration changes by restarting the SCA service:
systemctl restart sca
Installation Scripts
The automated installation includes two scripts for different purposes:
Installation Script (airgap_installer.sh)
Run a complete installation of the threat hunting module with all components and dependencies:
./airgap_installer.sh
This installation mode deploys:
- Complete ML model training infrastructure
- ClickHouse analytical database with optimized configurations
- PostgreSQL database for metadata and user management
- Superset dashboard interface with pre-configured threat hunting visualizations
- Kafka consumer services for real-time event processing
- Kubernetes deployment configurations for scalability and reliability
Full Installation Timeline:
- Initial setup and validation: 5-10 minutes
- Container image downloads: 15-30 minutes (depending on network speed)
- Database initialization and configuration: 10-15 minutes
- Service deployment and health checks: 5-10 minutes
- Total Expected Duration: 45-75 minutes
Training Configuration Update Script (update_training_jobs.sh)
Update ML training schedules and configurations without reinstalling the complete system:
./update_training_jobs.sh
Use this update mode to:
- Modify existing training schedules after initial deployment
- Add new data sources or training paths
- Adjust training frequency based on operational requirements
- Test new model configurations without full system reinstallation
Training Schedule Update Timeline:
- Configuration validation: 1-2 minutes
- Schedule deployment: 2-3 minutes
- Service restart and verification: 1-2 minutes
- Total Expected Duration: 5-10 minutes
After any installation mode completion, verify system functionality:
# Check all pods are running
kubectl -n seed-ml get pods

# Verify service connectivity
kubectl -n seed-ml get services

# Test dashboard accessibility
curl -k https://<threat-hunting-ip>:30443/health

# Check training job schedules
export KUBECONFIG=/etc/rancher/k3s/k3s.yaml
MLCORE_POD=$(kubectl -n seed-ml get pods | awk '/service-ml-core/ {print $1; exit}')

kubectl -n seed-ml logs "$MLCORE_POD" --since=24h \
| grep "MlTrainingSchedulerConfigurer : Zones:" | tail -n 1 \
| sed -e 's/^.*Zones: \[//' -e 's/\]$//' \
| sed 's/), /\),\n/g'

# View logs for services
kubectl -n seed-ml logs -f -l component=service-pipelines
Most important component labels for viewing logs:
service-pipelinesservice-inventoryservice-ml-coreml-data-exfiltration
Examples:
# View service-inventory logs
kubectl -n seed-ml logs -f -l component=service-inventory

# View service-ml-core logs
kubectl -n seed-ml logs -f -l component=service-ml-core

# View ml-data-exfiltration logs
kubectl -n seed-ml logs -f -l component=ml-data-exfiltration
For troubleshooting guidance specific to automated installation, including common configuration issues and diagnostic commands, see the Automated Installation Troubleshooting section in the main troubleshooting guide.