Dashboard
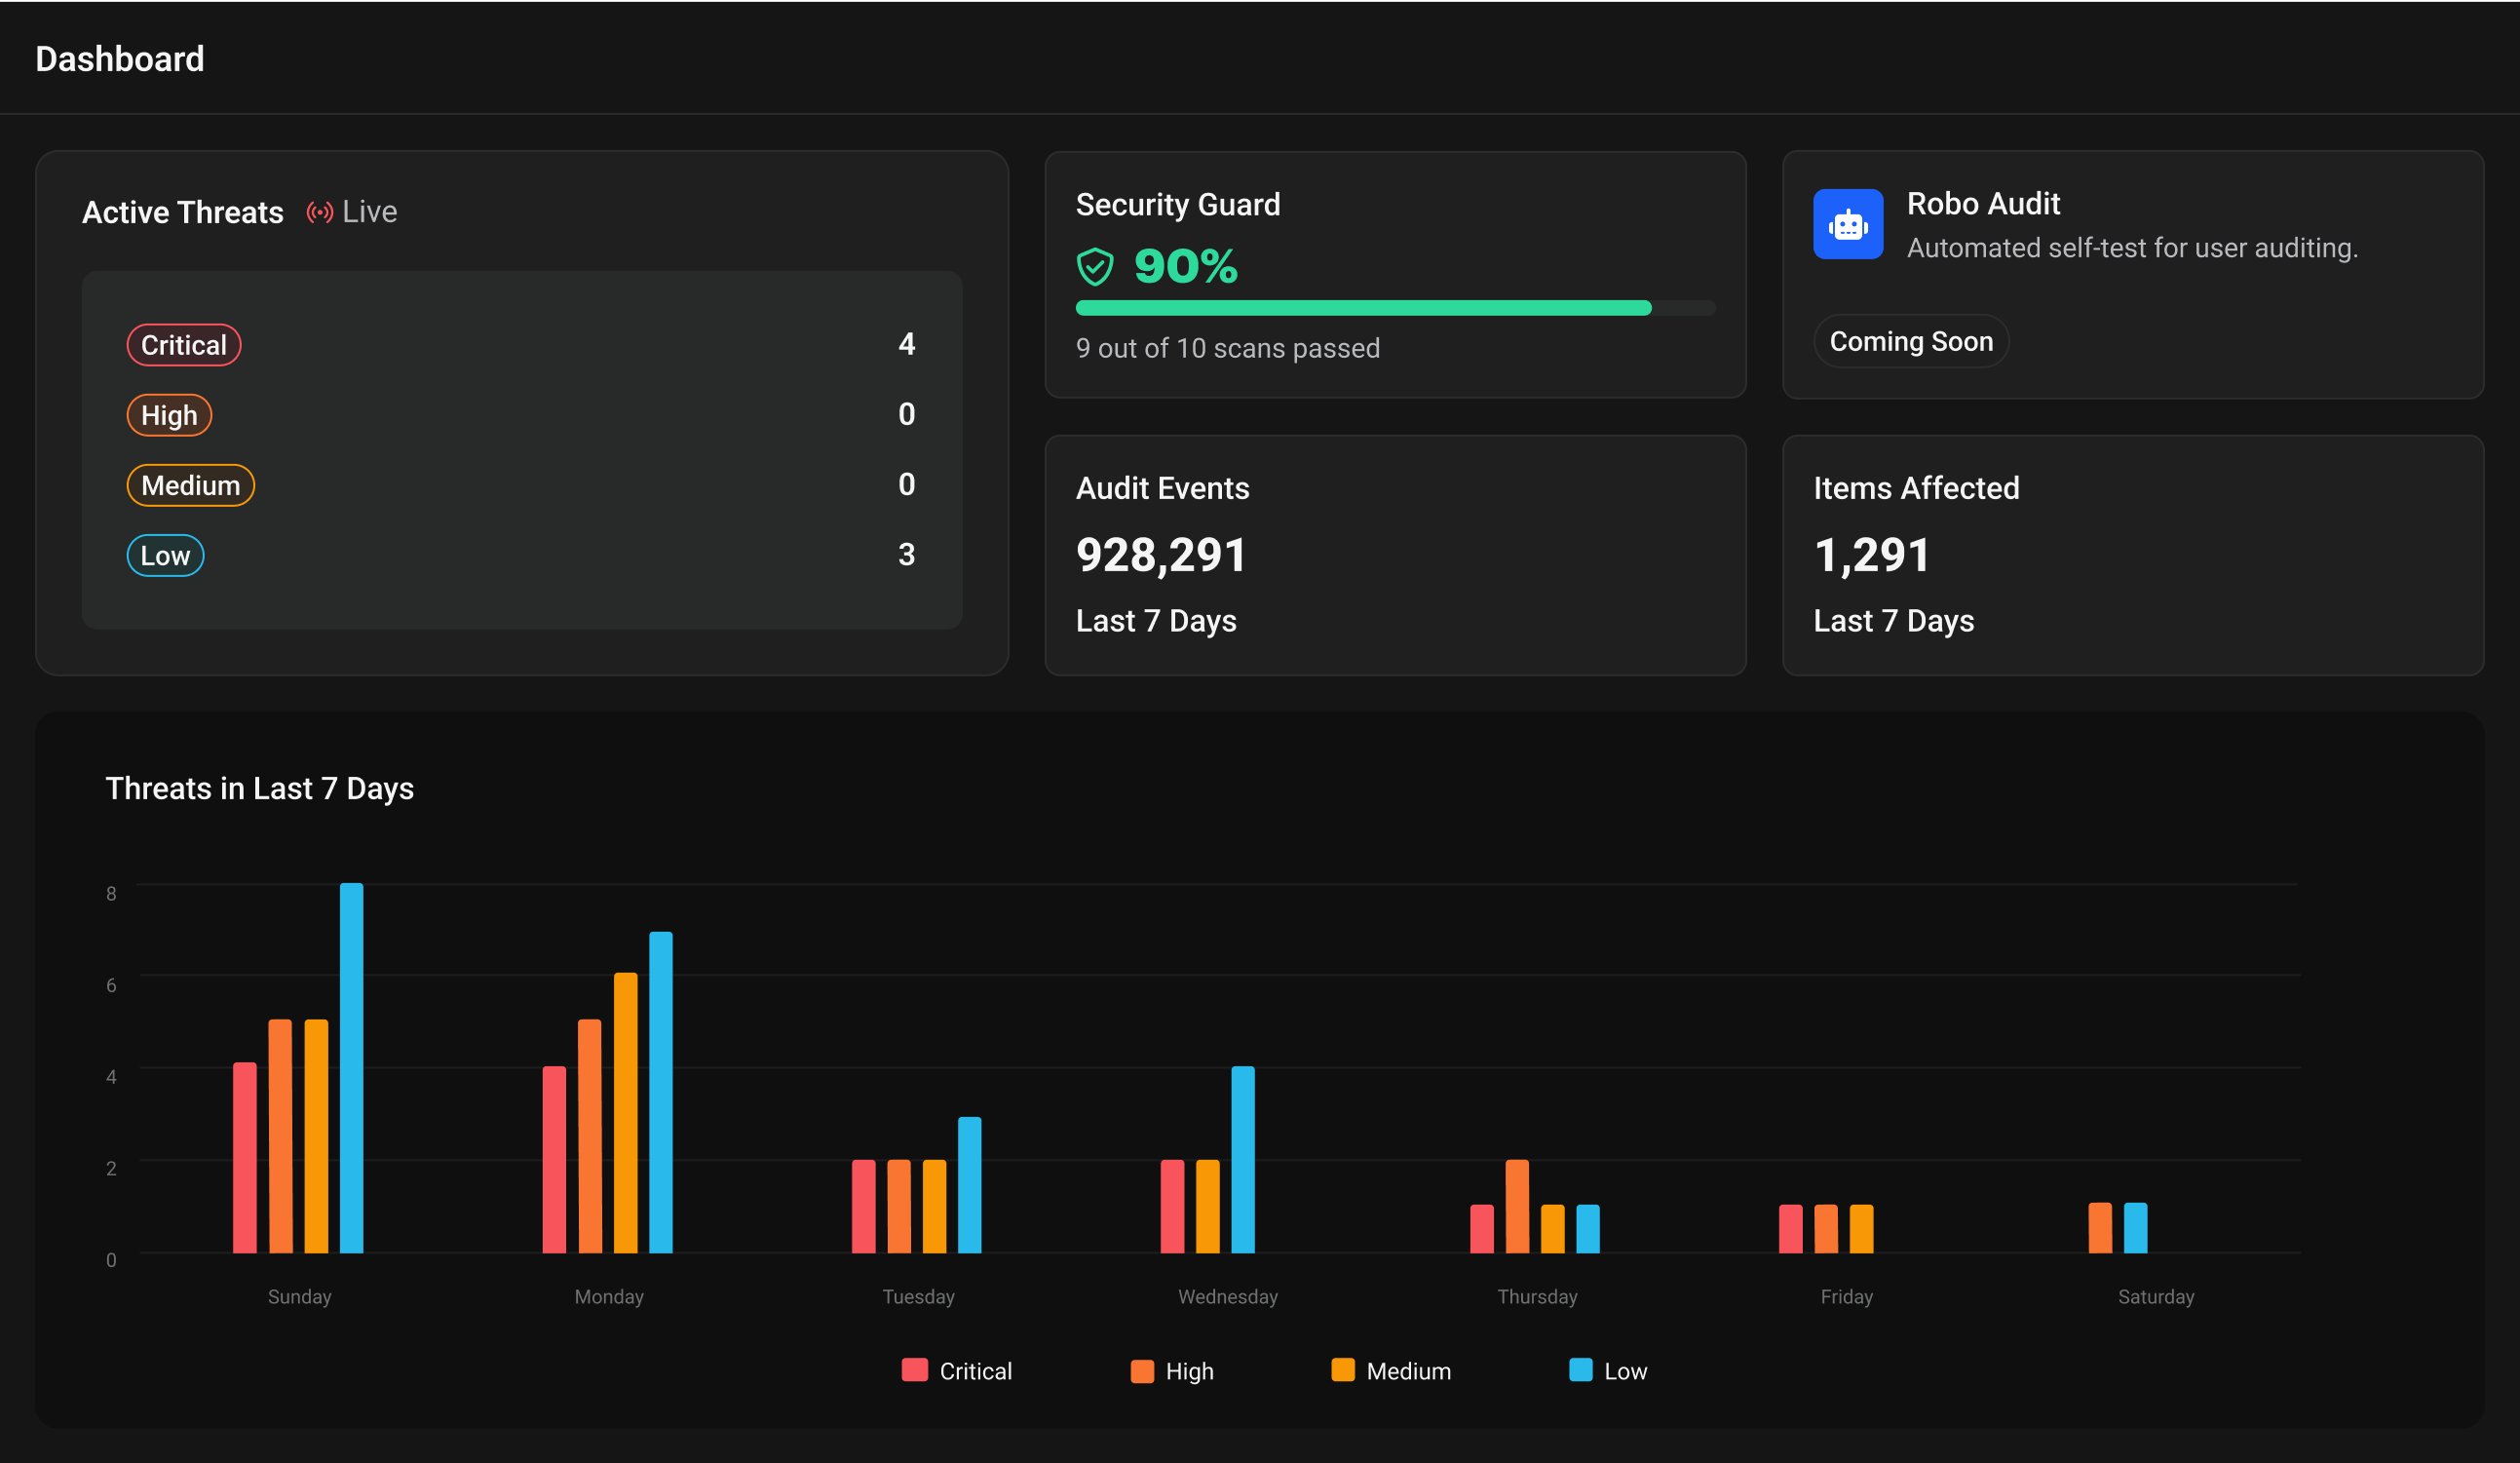
The Superna 5.x dashboard provides a centralized command center for monitoring your security posture, active threats, and system health. This real-time interface gives you immediate visibility into your environment's security status and helps you prioritize response efforts.
The dashboard automatically refreshes to show current data, ensuring you always have up-to-date information about your security environment.
Dashboard Components
- Active Threats
- Audit Events
- Items Affected
- Security Guard
- Robo Audit
Active Threats
The Active Threats widget displays current security incidents requiring attention, organized by severity level. This real-time view helps you prioritize response efforts based on threat criticality.
Severity Classification:
| Severity | Color | Description |
|---|---|---|
| Critical | Red | Immediate attention recommended for unusual activity patterns |
| High | Orange | Review within 1 hour for significant activity changes |
| Medium | Yellow | Address within 24 hours for moderate activity variations |
| Low | Blue | Review during regular maintenance for minor activity changes |
Click any threat count to open Threat Detection for detailed investigation and response options.
Audit Events
Displays the total number of security-relevant events captured over the past 7 days. This metric helps you understand the volume of activity in your environment and identify unusual spikes that may indicate security incidents.
Monitor daily patterns to establish baselines. Sudden spikes may indicate automated attacks or system misconfigurations.
Items Affected
Shows the total count of files and folders impacted by security events during the past 7 days. This metric quantifies the scope of security incidents and helps assess potential data exposure.
High numbers may indicate widespread attacks or system issues requiring immediate investigation.
Security Guard
Security Guard automated scanning will be available in an upcoming release. This feature will provide continuous security posture assessment with percentage-based health scoring.
Robo Audit
Robo Audit automated permission testing will be available in an upcoming release. This feature will provide continuous validation of access controls and permission configurations.
Weekly Threat Chart
The Weekly Threat Chart provides a visual timeline of security events over the past 7 days, with color-coded severity indicators for each day. This trend analysis helps you identify patterns in security activity, track threat volume changes over time, and prioritize investigation efforts based on daily activity levels.
See Also
- Threat Detection Introduction - Understanding threat detection and response
- Jobs - Monitor automated response tasks and system operations
- Onboarding Mode - Monitor detection rates during initial setup