Jobs
Jobs are automated tasks in Superna 5x that run specific operations without manual intervention. Think of them as scheduled or on-demand work items that the system executes to maintain your environment, protect your data, and monitor security.
Each job represents a specific task such as collecting inventory from storage devices, creating data snapshots, monitoring for security threats, managing device configurations, and responding to detected threats.
Jobs run in the background and provide detailed feedback about their progress, success, or any issues encountered.
Job Types
| Category | Job Type | Purpose | Availability |
|---|---|---|---|
| Configuration | Add Managed Device | Add new device to Superna management | ✅ |
| Delete Managed Device | Remove device from management | ✅ | |
| Modify Managed Device | Update device configuration | ✅ | |
| General | Collect Inventory | Gather device inventory information | ✅ |
| Create/Update Snapshot | Create or update data snapshots | ✅ | |
| Delete Snapshot | Remove existing snapshots | ✅ | |
| Collect Recovery Items | Gather items for recovery | ✅ | |
| Recovery Report | Generate recovery status reports | ✅ | |
| Recovery Search | Search for recoverable items | ✅ | |
| Item Recovery | Restore specific items | Soon | |
| Threat Detection | Lockout Threat Detection Event | Lock out users during threat event | ✅ |
| Restore Threat Detection Event | Restore access after threat resolution | ✅ | |
| Apply Threat Detection Action | Execute threat response actions | ✅ | |
| Upgrade Event Severity | Automatically escalate threat severity | ✅ | |
| Security Guard | Security Guard | Monitor for security threats | Soon |
| Robo Audit | Auditor Job Report | Generate audit reports | Soon |
Jobs Dashboard
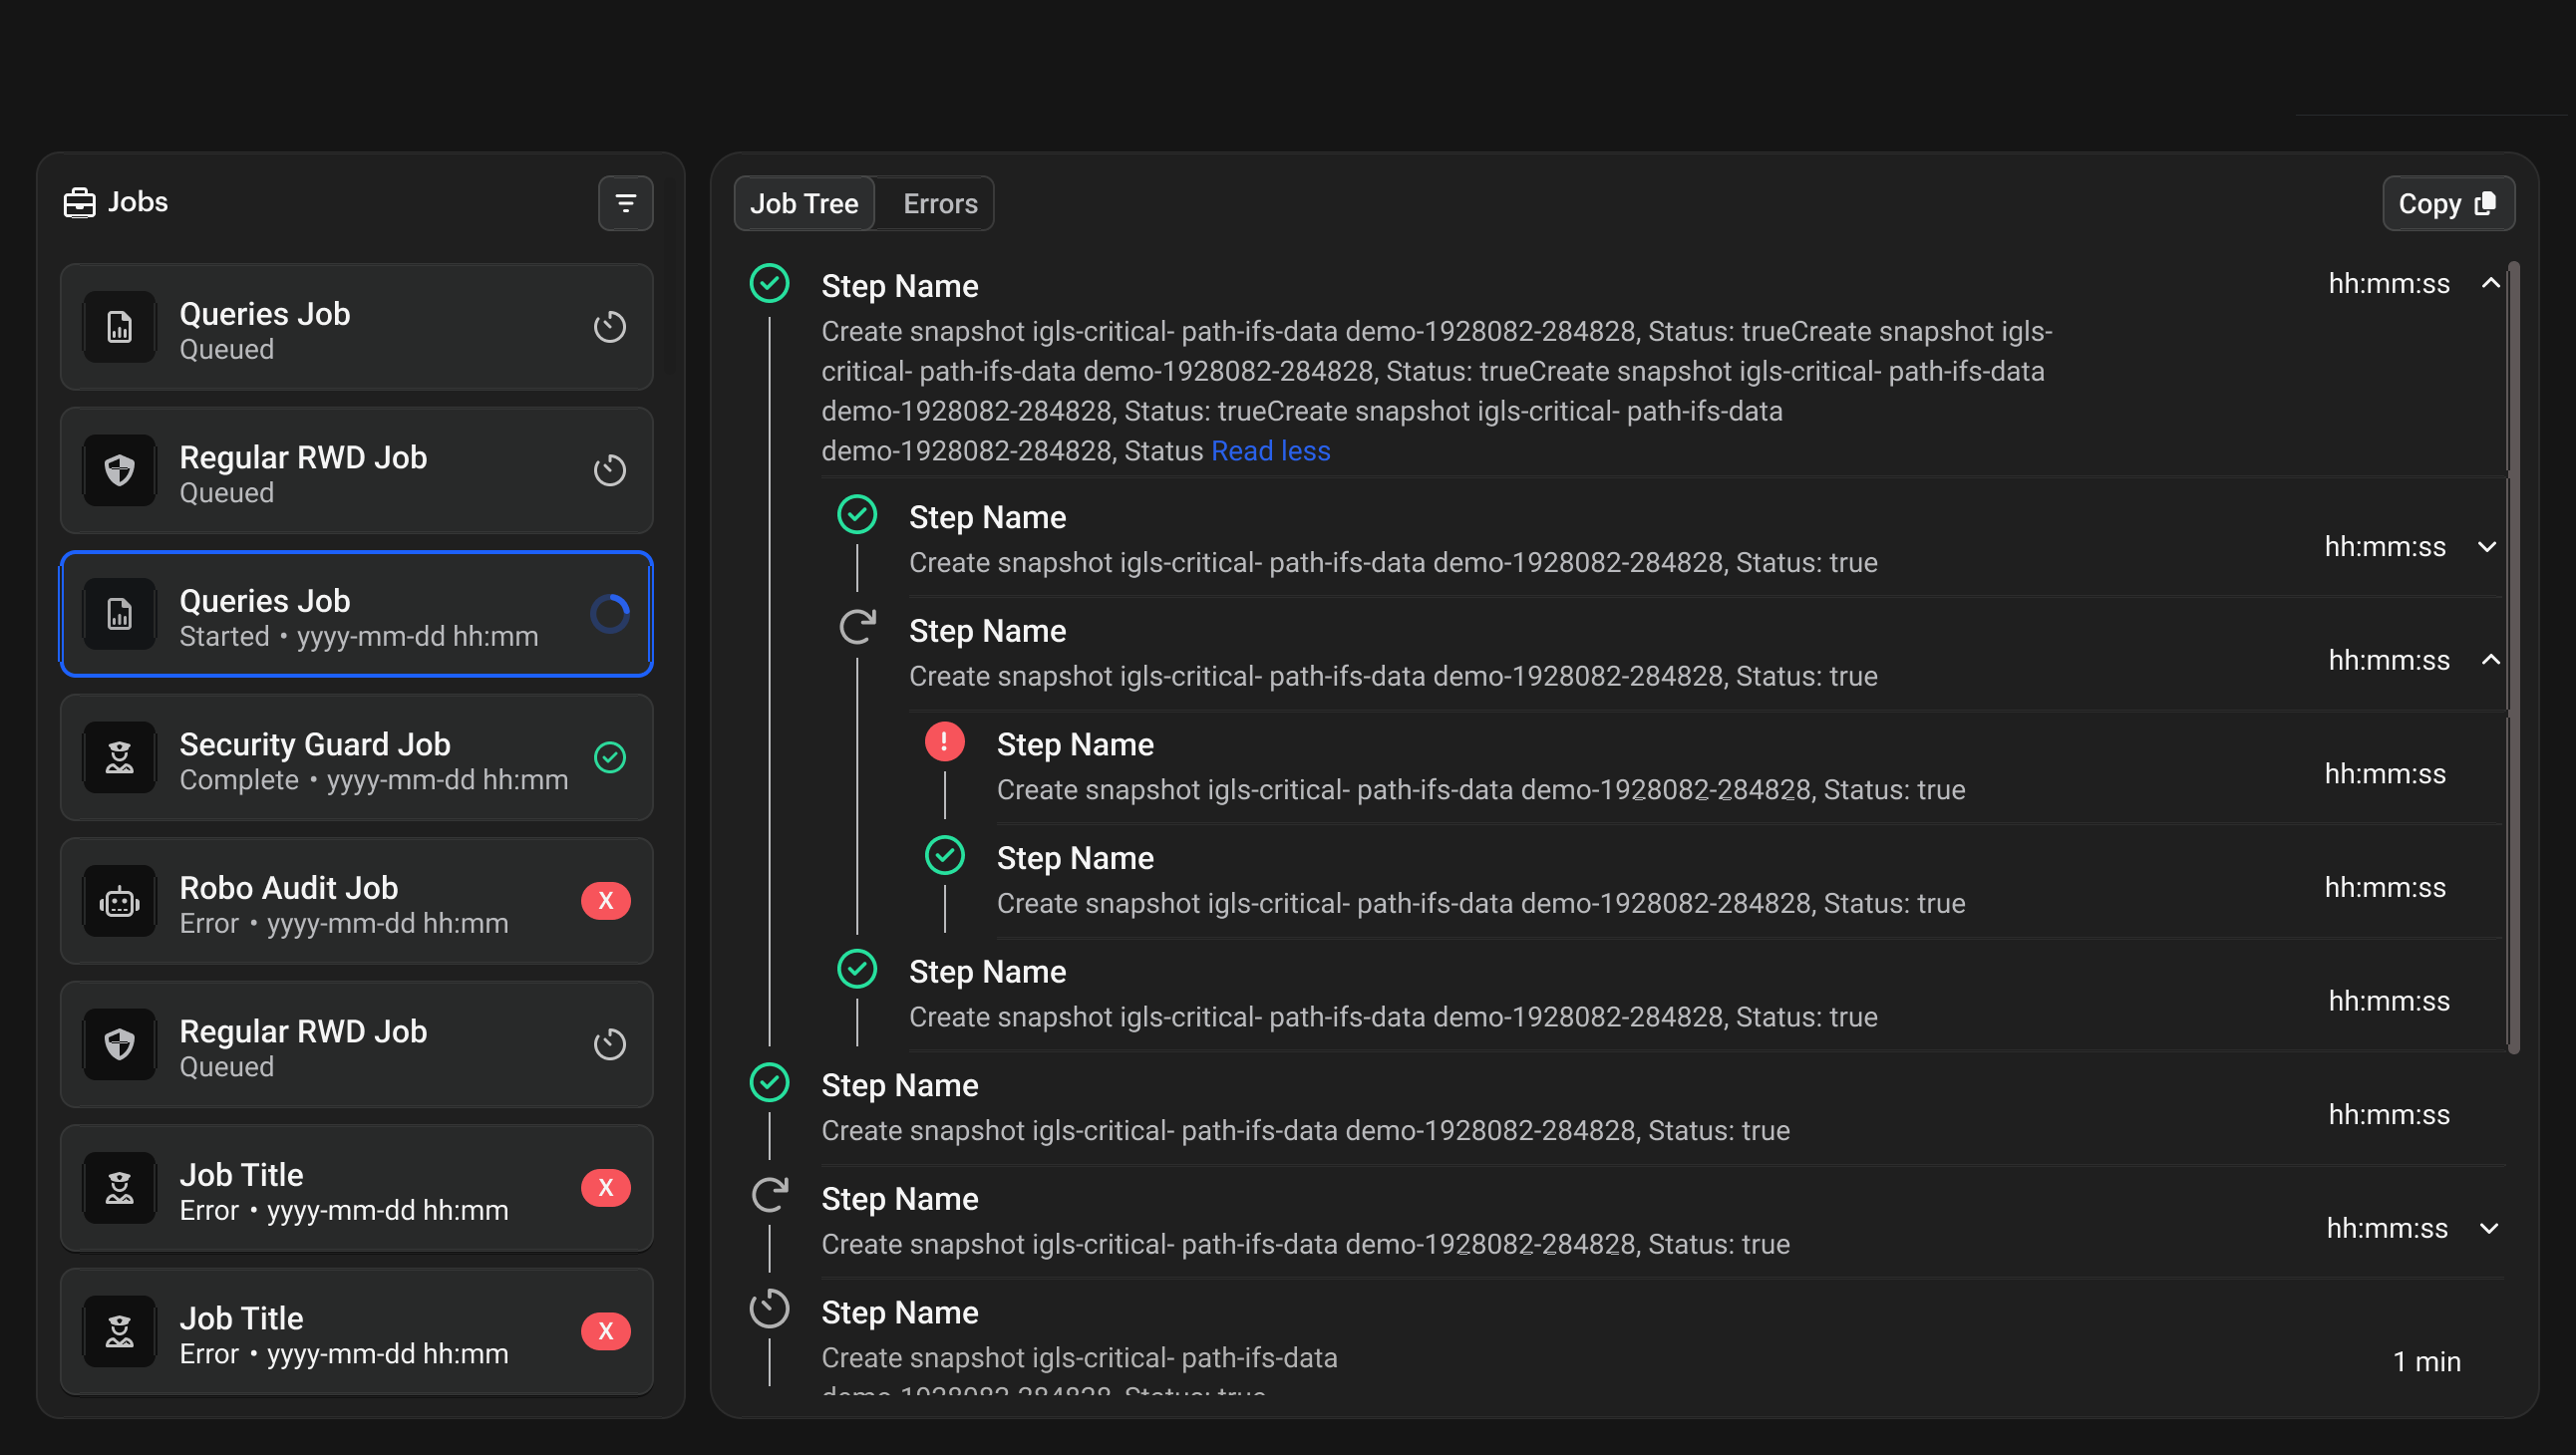
The Jobs dashboard displays all job activities and provides comprehensive monitoring capabilities. From here you can monitor job execution status, view job history and logs, and access detailed job information.
Dashboard Interface
The main interface shows a list of all jobs with visual status indicators. Click any job to view detailed information in the right panel, which contains:
-
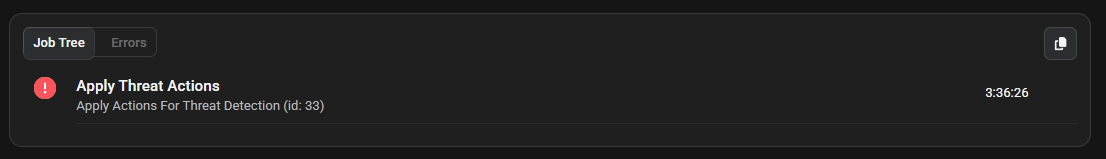
Job Tree Tab: Shows step-by-step execution details using visual indicators. A green circle with checkmark indicates finished steps, red circles with X marks show errors, blue spinning icons indicate running steps, and gray clock icons show queued steps. When a job is running, you can monitor which task is currently executing, see the specific step being performed, watch real-time progress updates, and track elapsed time. Click any step to view status information, error messages, configuration parameters, output logs, and execution time.
-
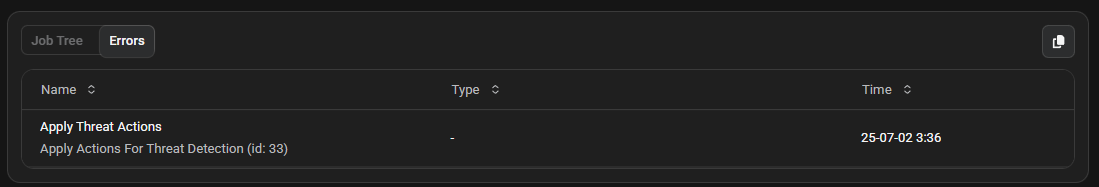
Errors Tab: When a job fails, this tab provides comprehensive error information including job name and description, error timestamp, specific error messages, error codes, stack traces, and suggested actions. Common error types include configuration errors, permission errors, resource errors, and data errors.
-
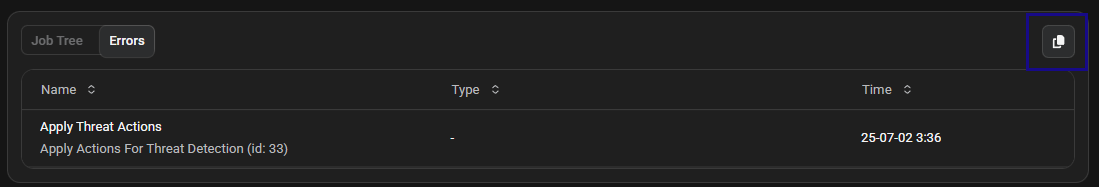
Copy Function: Click the copy button to export job information in JSON format to your clipboard. This includes the Job Step ID, name and description, state (such as FINISHED or ERRORS), start and completion timestamps, parent/child relationships, and the nested steps array.
Example Copied Job Data
Successful job:
[
  {
    "__typename": "JobStep",
    "id": "13700.0",
    "name": "Collect Inventory",
    "description": "Collect inventory for vast-12",
    "state": "FINISHED",
    "startedAt": "2025-07-02T18:30:00.169Z",
    "completedAt": "2025-07-02T18:30:36.071Z",
    "parentId": null,
    "steps": []
  }
]
Failed job:
[
  {
    "__typename": "JobStep",
    "id": "13701.0",
    "name": "Apply Threat Actions",
    "description": "Apply Actions For Threat Detection (id: 33)",
    "state": "ERRORS",
    "startedAt": "2025-07-02T18:36:26.326Z",
    "completedAt": "2025-07-02T18:36:26.402Z",
    "parentId": null,
    "steps": []
  }
]
Job Status Types
| Status | Description | Display Format |
|---|---|---|
| Queued | Waiting to start | Queued |
| Running | Currently executing | Running |
| Finished | Successfully completed | Finished • yyyy-mm-dd hh:mm |
| Errors | Failed during execution | Errors • yyyy-mm-dd hh:mm |
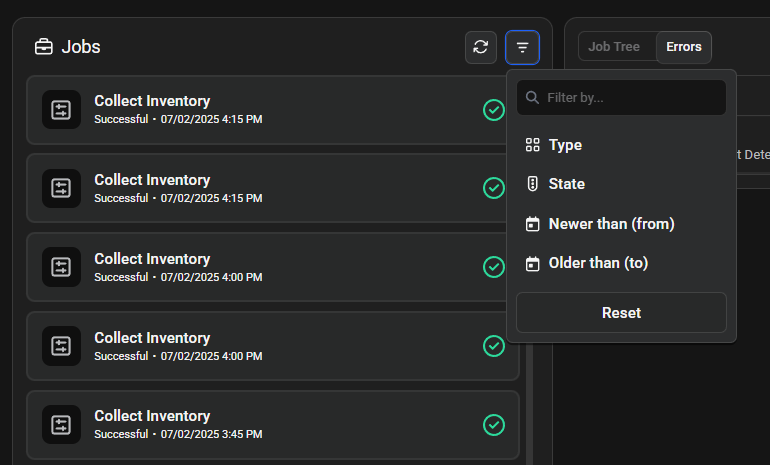
Filtering Jobs
The Jobs dashboard includes powerful filtering options to help you find specific jobs quickly. Click the filter icon or "Filter by..." field to access the filter panel.
How to Use Filters
-
Open the Filter Panel
Click the filter icon or "Filter by..." field to expand the filter options. -
Filter by Job Type
- Click the "Type" dropdown
- Check the boxes for job types you want to see
- Multiple selections show jobs of any selected type
-
Filter by Job State
- Click the "State" dropdown
- Check the boxes for states you want to include:
- Queued (waiting to start)
- Running (currently executing)
- Finished (successfully completed)
- Errors (failed during execution)
- Select multiple states to see jobs in any of those states
-
Filter by Date Range
- Click "Newer than (from)" to set a start date
- Click "Older than (to)" to set an end date
- Use the calendar picker to select dates
- Click "Clear" to remove a date selection
-
Apply Multiple Filters
Combine filters to narrow results. For example:- Type: "Threat Detection" + State: "Errors" = Shows only failed threat detection jobs
- State: "Finished" + Date range = Shows successful jobs within specific timeframe
-
Clear Filters
Click "Reset" to remove all filters and show all jobs.
See Also
- Dashboard - Monitor overall system status and job performance
- Inventory Management - Device management and inventory collection jobs
- Threat Detection - Understanding threat detection jobs and responses
- User Management - Configure user lockout actions triggered by jobs
- Data Forensics - Recovery jobs and forensic analysis