Platform Overview
Superna 5.X offers a comprehensive platform for data management and security. This overview highlights the key components and their functions within the platform.
- Dashboard
- Threat Detection
- Inventory
- Jobs
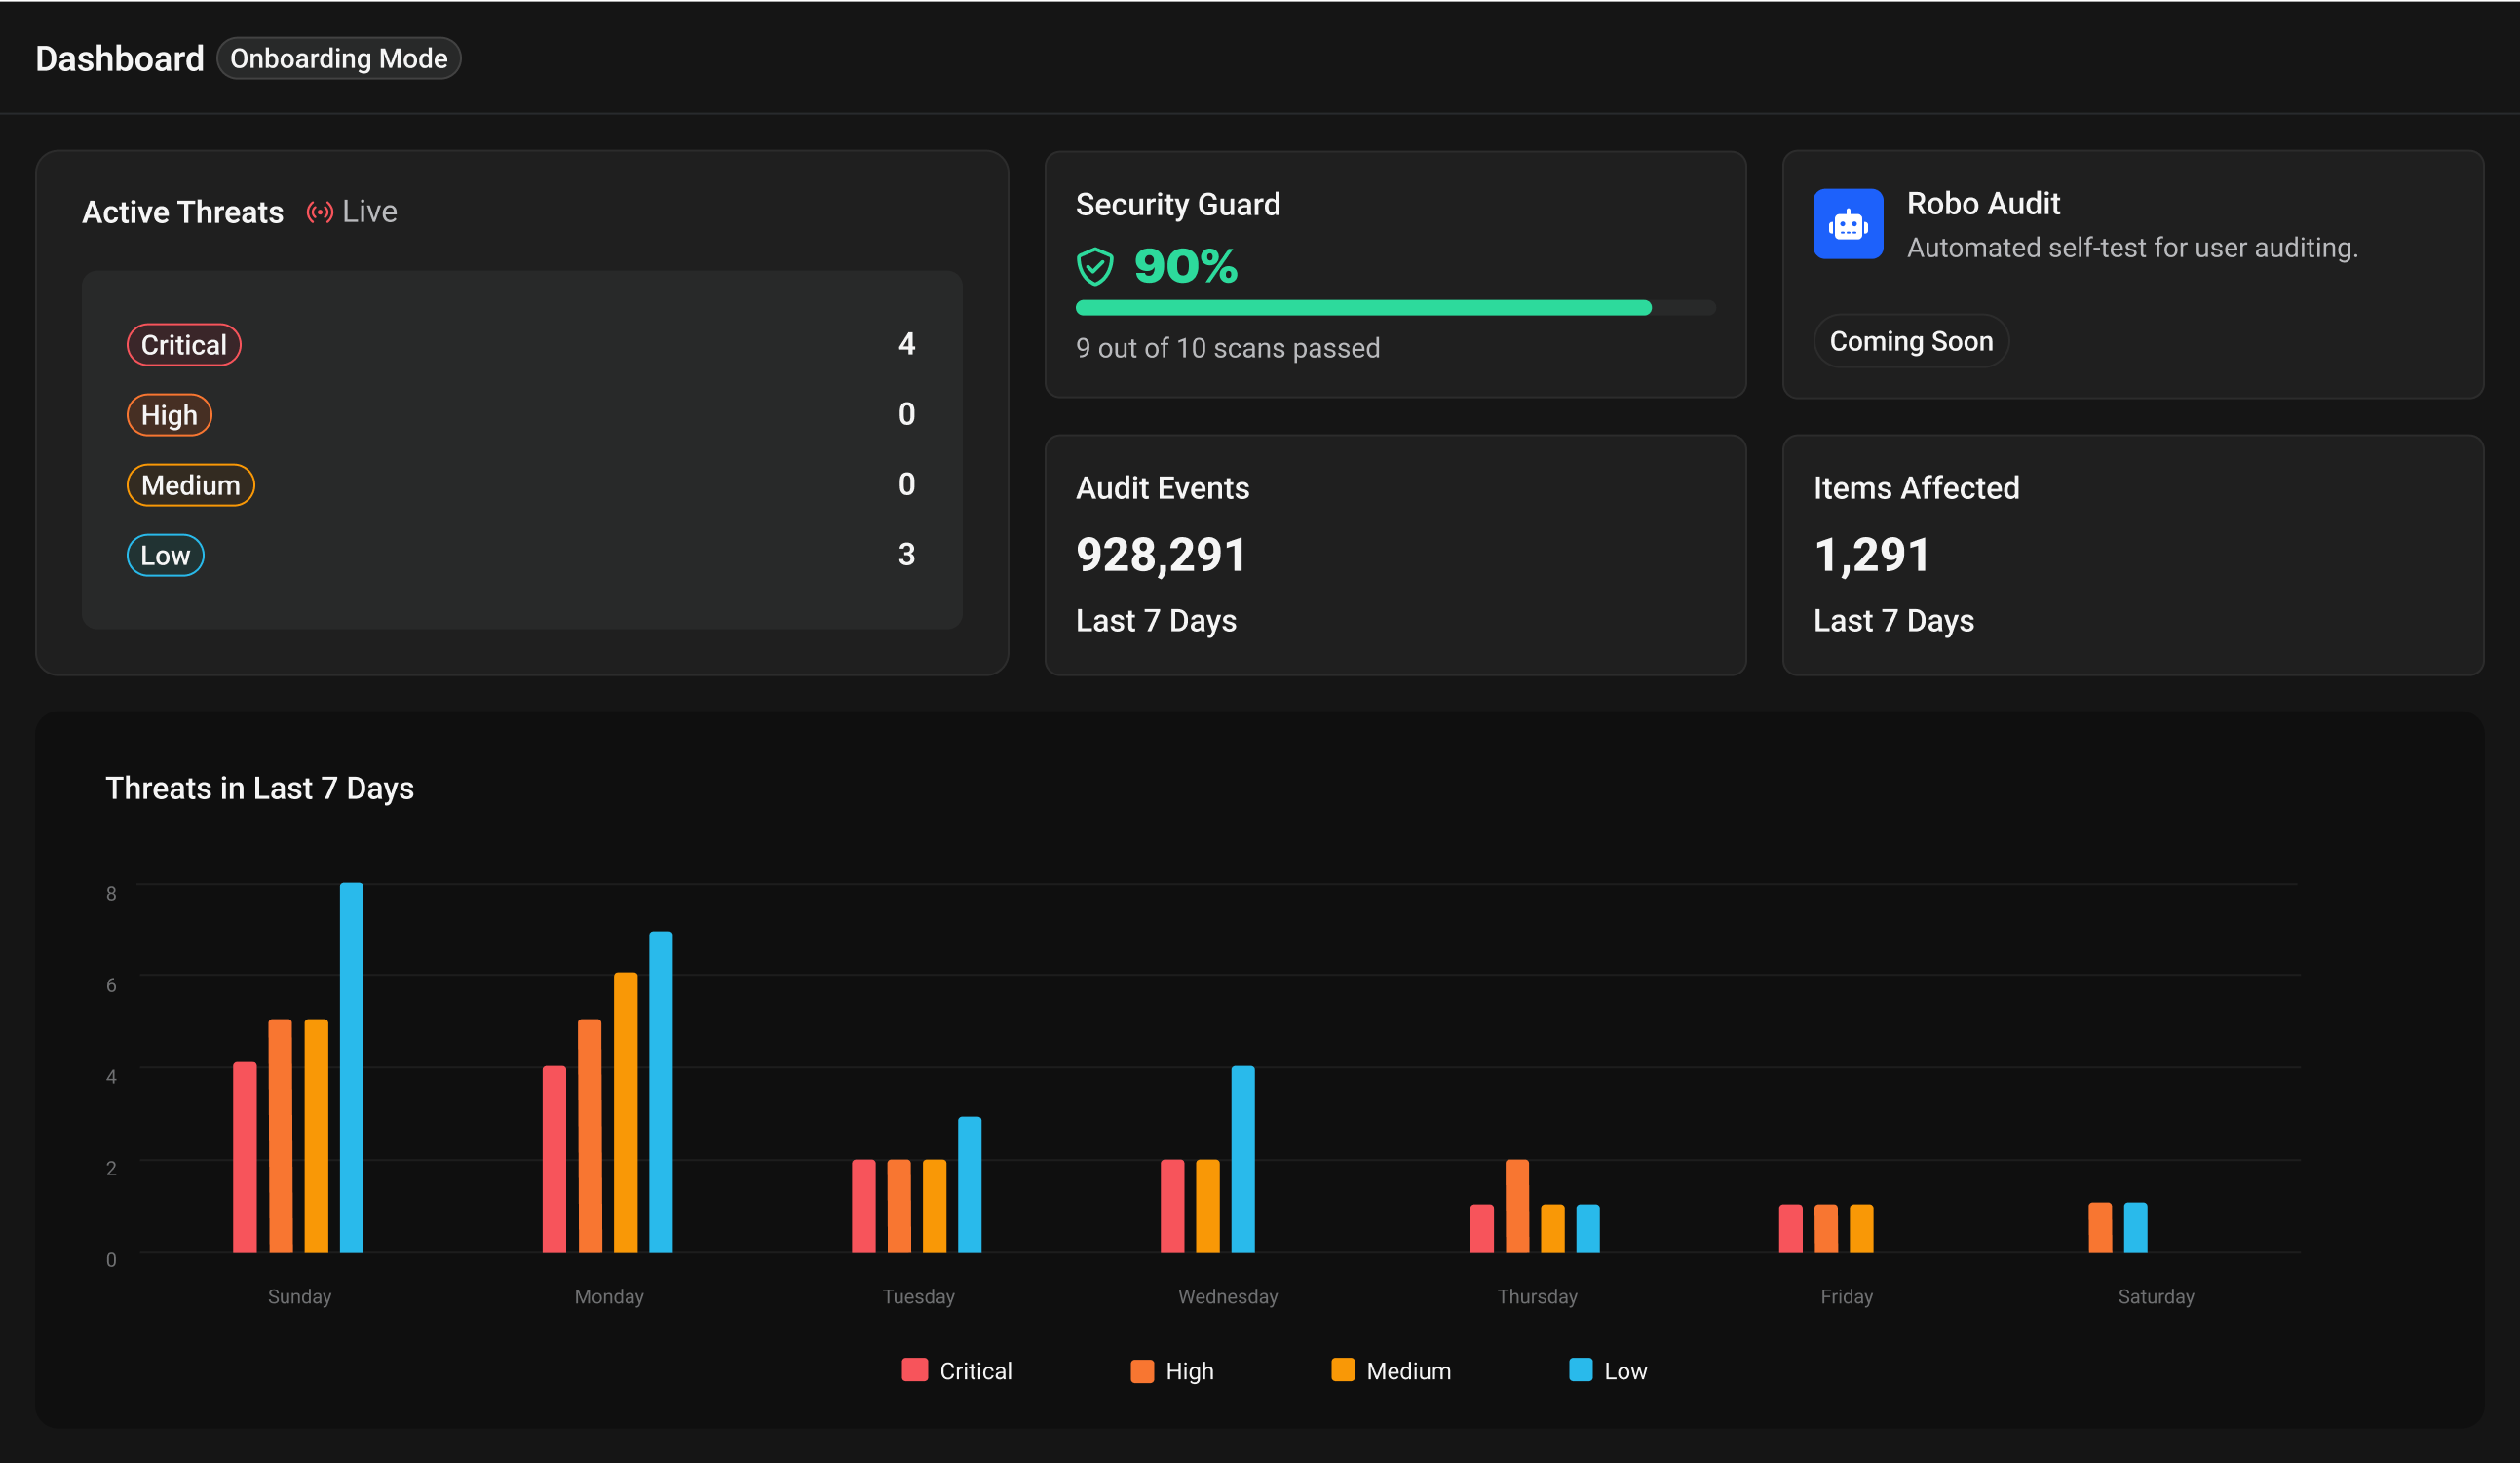
Active Threats
Current threat count by severity Critical → Low priority classification Click to investigate details
Security Guard
Security scan success rate Green (80-100%): Healthy Yellow (60-79%): Warning Red (<60%): Critical
Robo Audit
Automated security verification Permissions and access testing Continuous vulnerability scanning
Audit Events
7-day event activity Security-relevant actions System-wide monitoring
Items Affected
Files and folders impacted 7-day impact scope Impact quantification
Weekly Threat Chart
Daily threat visualization Color-coded by severity Pattern and trend identification
The dashboard provides a centralized view of your security status with interactive widgets. Monitor active threats categorized by severity level, track security scan performance through the Security Guard score, and view automated audit results.
The Weekly Threat Chart displays daily security incidents color-coded by severity, allowing you to identify patterns and trends. Track the total number of audit events and affected files to quantify security impact and prioritize response efforts.
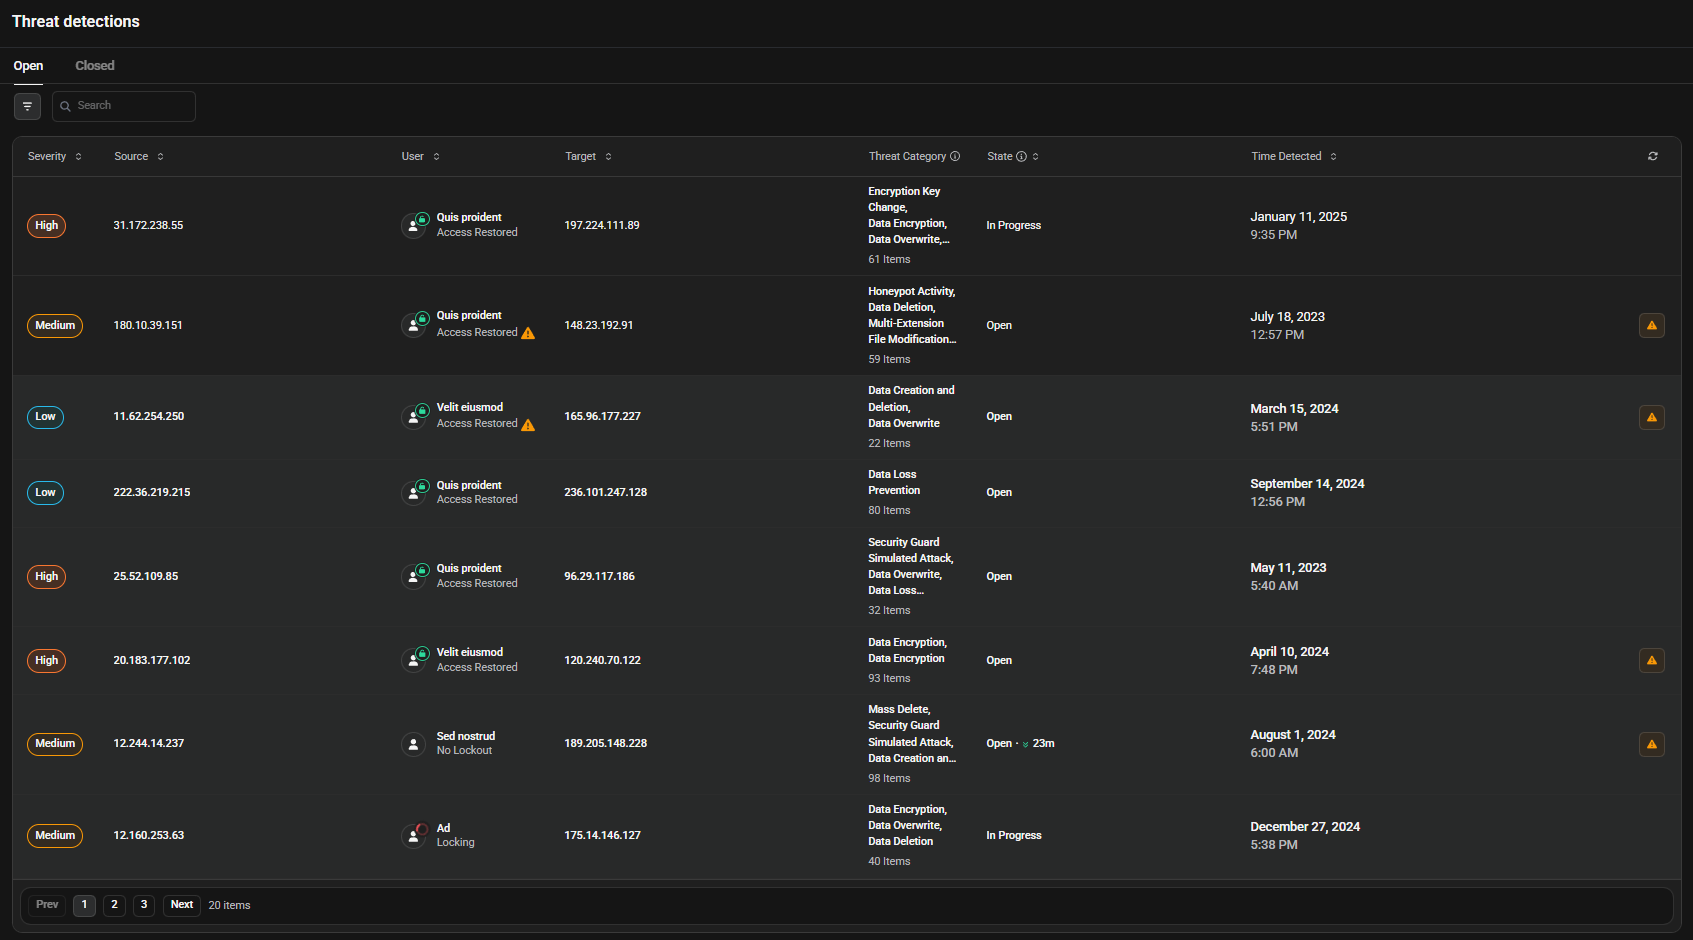
Open Events
Active threats requiring immediate attention Real-time monitoring of ongoing security incidents Automatic user lockout prevents damage during active threats
Closed Events
Resolved threats with complete forensic timeline Investigation notes and resolution outcomes Compliance documentation and audit trail
Threat Details
Each threat shows source IP, user, target device, and category Event timeline with timestamps and affected files Severity level and response time guidelines
The threat detection engine uses machine learning to find threats that rule-based systems miss. It learns normal behavior in your environment and flags anomalies that indicate potential attacks.
Detect ransomware before encryption spreads and identify unusual user activity that signals compromised credentials. The system can lock suspicious users automatically to prevent damage, using dual thresholds to reduce false positives.
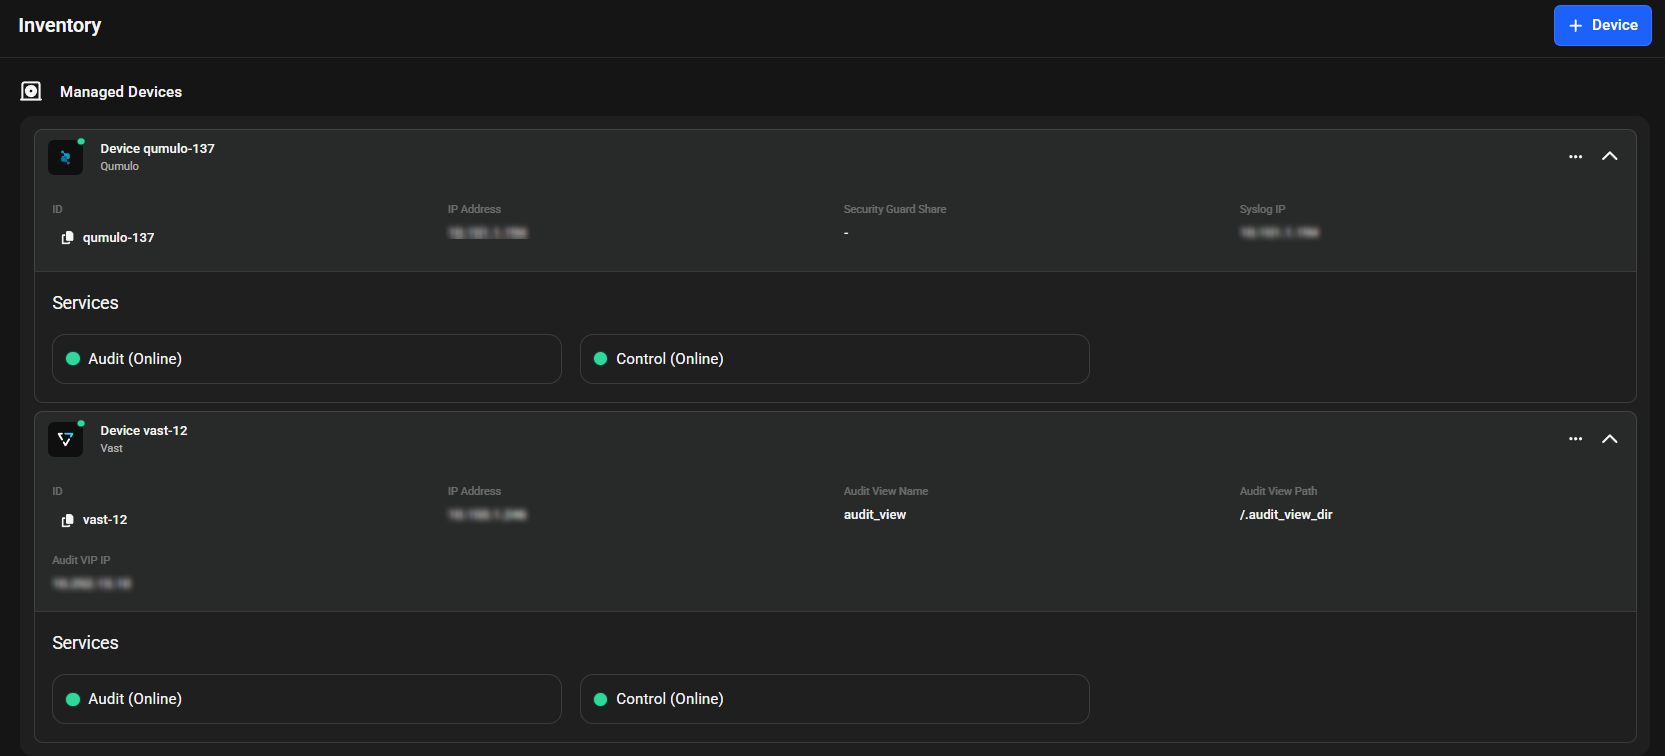
Add Devices
Simple UI-driven workflow for adding storage systems Automated device integration with background job processing Connection validation and credential testing
Device Management
Monitor service status with real-time health indicators Edit device credentials and configuration settings Centralized inventory view of all connected devices
Inventory management catalogs all devices, systems, and components under protection. This creates visibility across your infrastructure because you can't secure what you don't know exists.
Identify coverage gaps where assets lack protection and track license usage to prevent security lapses. The system also flags hardware limitations that affect monitoring and provides documentation of protected assets for compliance audits.
The Jobs system automates security tasks that would otherwise require manual work. It runs scheduled scans when staff is unavailable and executes complex procedures without human error.
The system alerts administrators when tasks fail, preventing silent security lapses. It documents all actions for compliance and creates consistency across all shifts, eliminating human-caused security gaps.