User Guide
This guide provides a comprehensive overview of setting up and configuring Disaster Recovery for PowerScale OneFS, VAST and Qumulo.
Requirements
- VAST
- Qumulo
VAST Requirements
- VAST Version: 5.0 or 5.1
- Administrator Level Account within VAST
- Eyeglass VM successfully deployed
- Network Connectivity from Eyeglass Appliance to VAST storage device
Qumulo Requirements
- Qumulo Version: 6.2.2.1
- Administrator Level Account within Qumulo
- Eyeglass VM successfully deployed
- Network Connectivity from Eyeglass Appliance to Qumulo storage device
Installation
- VAST
- Qumulo
- PowerScale OneFS
Adding a VAST Cluster to Eyeglass
-
Open Eyeglass Main Menu: On the Eyeglass Appliance, go to the bottom left corner and click on Eyeglass Main Menu. Then, choose Add Managed Device.
-
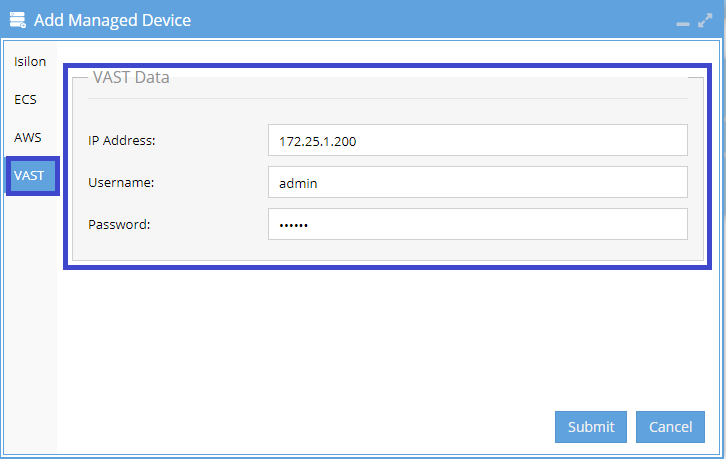
Select VAST: In the Add Managed Device window, choose VAST from the options on the left.
-
Enter VAST Details: Fill in the following fields and click Submit:
- IP Address of the VAST cluster
- Username
- Password
-
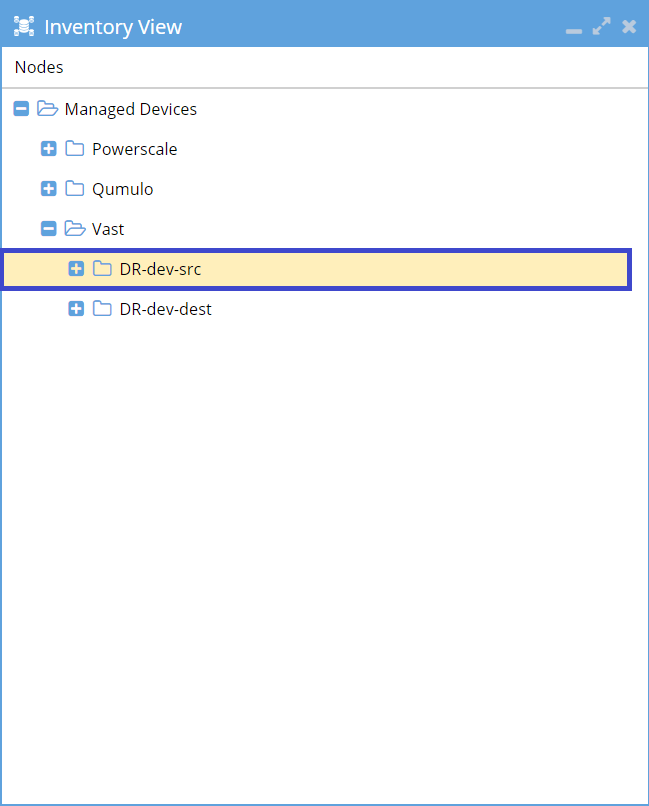
Check Inventory View: Once submitted, the VAST cluster should appear in the Inventory View.
-
Success: You have now successfully added the VAST cluster to Eyeglass.
The device should appear in the inventory right away, but it might take a few minutes for all inventory details to show up.
Adding a Qumulo Cluster to Eyeglass
-
Within the Eyeglass Appliance, click Eyeglass Main Menu in the bottom left corner and select Add Managed Device.
-
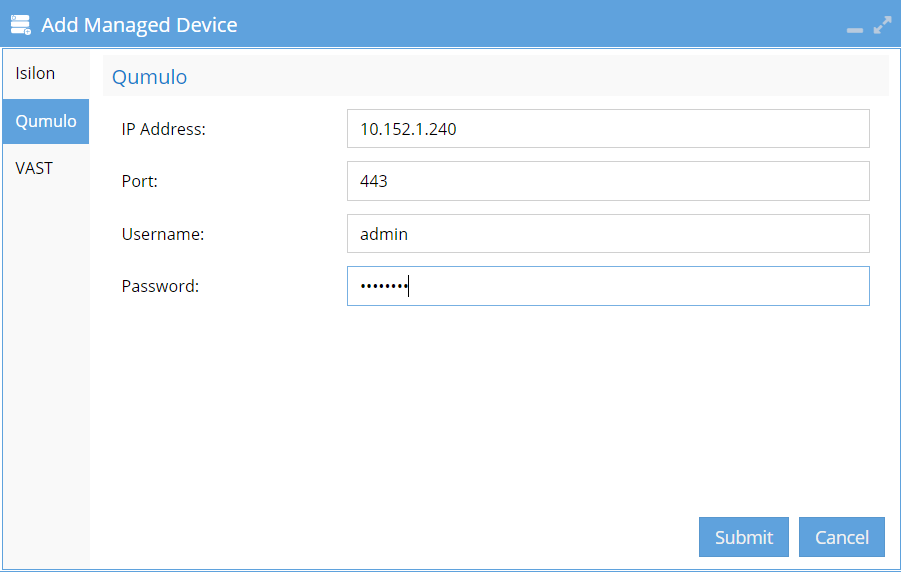
In the Add Managed Device window, select Qumulo from the left-hand options.
-
Enter the following details and click Submit:
- IP Address of Qumulo Cluster
- Port (if different than 443)
- Username
- Password
-
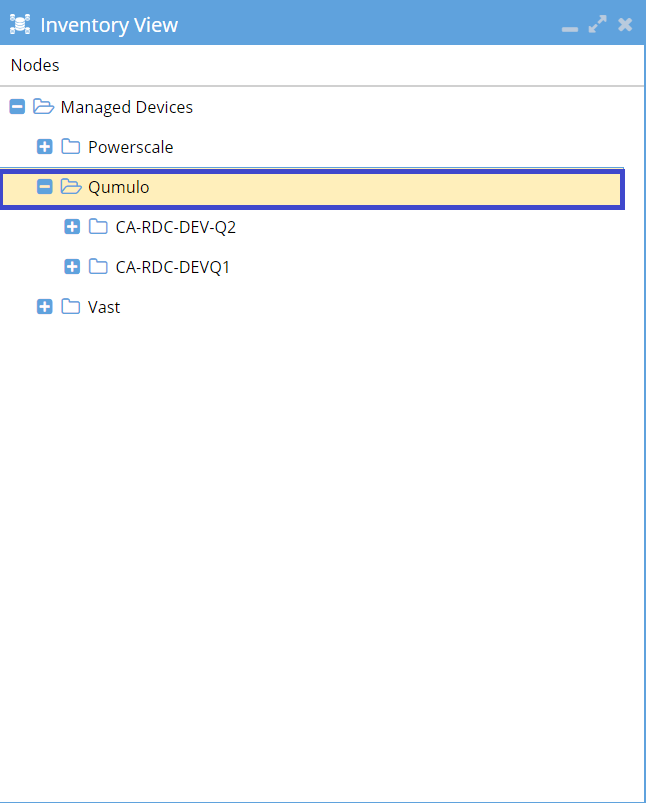
If the operation is successful, you will see the Qumulo cluster within the Inventory View.
-
Success: You have now successfully added the Qumulo cluster to Eyeglass.
The device should appear in the inventory right away, but it might take a few minutes for all inventory details to show up.
Adding a PowerScale OneFS Cluster to Eyeglass
-
Ensure Compliance:
- Ensure that both the source and target clusters comply with the support feature matrix.
- Verify that all PowerScale OneFS cluster replication pairs operate on a PowerScale OneFS version listed and supported as per the System Requirements / Feature Release Compatibility matrix.
-
Open the Eyeglass UI:
- Open the Eyeglass UI to get started.
-
Navigate to Add Managed Device:
- In the Eyeglass Main Menu, select Add Managed Device to start adding your cluster configurations.
-
Provide Cluster Details:
- Provide the cluster details as prompted by the interface.
-
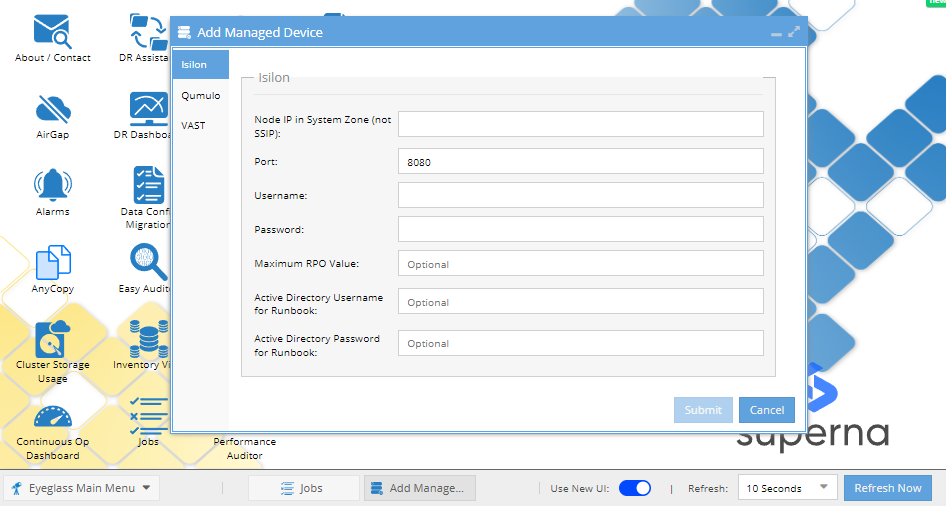
Complete the Form:
- Complete the form as required for your setup. Refer to the table below for information about each form input.
- Node IP in System Zone (not SSIP): Provide an IP address allocated for the System Access Zone. Avoid using SSIP, as it is unsuitable for administrative connections.
infoStarting from release 2.5.5, it is mandatory to use a node IP with dynamic IP allocation within a subnet that is part of the System Access Zone. This requirement is due to a CSRF security patch that disables basic authentication and prevents session tokens from being shared between PowerScale OneFS nodes. For further details, refer to the associated technical documentation.
- Port: Default to
8080unless there is a requirement for a different port number. - Username and Password: Input the username and password of the Eyeglass service account.
- Maximum RPO Value: (Optional) Define the recovery point objective in minutes, if desired.
- Active Directory Username and Password for Runbook: (Optional) Enter if you're using AD credentials for Runbook automation.
-
Submit the Form:
- Submit the form to add the cluster to Eyeglass.
Configuration Replication Guide
What is Configuration Replication?
Configuration replication involves copying metadata associated with files on a storage cluster. This metadata controls access to data, as well as failback and replication mappings, schedules, and properties. For detailed information on what is specifically replicated, please refer to the sections for different storage vendors below.
Configuration Replication: What is Being Copied?
- PowerScale OneFS
- VAST
- Qumulo
PowerScale OneFS
Configuration replication for PowerScale OneFS’s PowerScale OneFS cluster covers the following elements:
- SMB Shares
- NFS Exports
- Policies
- IP Pools
- Access Zones
- Network Configuration
- Quotas
- Snapshot Schedules
- User Access Controls
VAST
Configuration replication for VAST covers the following elements:
- Views
- ViewPolicies
- S3 Lifecycle Rules
Qumulo
Configuration replication for Qumulo covers the following elements:
- SMB Shares
- NFS Exports
- Snapshot Policies
How-to: Initiating, Monitoring, and Completing Configuration Replication
This section explains how to start, monitor, and finish configuration replication. In Eyeglass, these replication tasks are handled as Jobs that run automatically every 5 minutes in the Running Jobs section of the Jobs window, regardless of the vendor. If you need to manually start a configuration replication or check your system’s readiness, follow the steps below.
Prerequisites
Before starting configuration replication, ensure you have:
- A predetermined candidate for configuration replication.
- Access to the Jobs page within Eyeglass.
-
Navigate to the Jobs page within Eyeglass.
-
In the Jobs window, select Job Definitions from the left-hand menu.
-
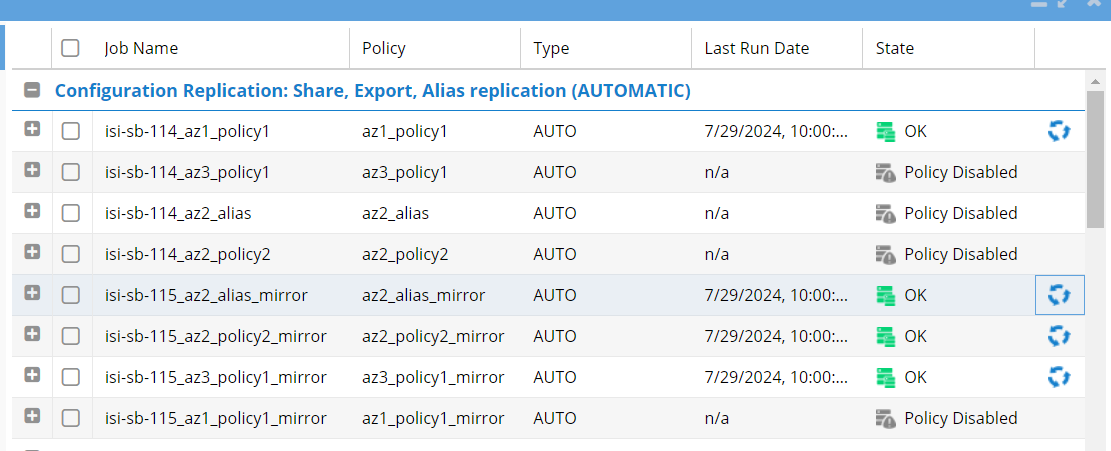
In the Job Definitions table, navigate to the section relevant to your candidate. All configuration replication jobs are nested under sections that begin with “Configuration Replication.”
-
Our supported storage vendors are organized in the following manner:
- PowerScale OneFS
- VAST
- Qumulo
- Configuration Replication: Share, Export, Alias replication
- Configuration Replication: Snapshot Schedules
- Configuration Replication: Access Zone replication
- Configuration Replication: View replication
- Configuration Replication: Replication Relationship
-
Find your specific candidate in the list, then click on the row or checkbox next to it. The row will be highlighted in yellow.
infoYou can select multiple rows if you want to run several jobs at the same time.
-
Look at the State column in the table. If the state is OK, you can proceed. The State column can show the following statuses:
-
OK: No action needed; the job is ready to run.
-
User Disabled: The job was turned off by a user. To enable it, click Select a bulk action at the bottom right of the Jobs window, then choose Enable/Disable.
-
Warning: This indicates a non-blocking issue that might cause problems if the job runs.
- To investigate the warning:
- Go to DR Dashboard.
- Select the job type from the left-hand menu.
- In the next screen, find the object associated with the warning and click the value in the DR Failover Status column.
- In the new window, expand the Eyeglass Configuration Replication Readiness folder.
- Click the value that appears below to view the warning details in the Additional Status Information section at the bottom of the window.
- To investigate the warning:
-
Error: This indicates a blocking issue, meaning the job cannot run until the issue is resolved.
- If a job failed recently, you can:
- Click on Running Jobs in the left-hand navigation.
- Find the failed job in the resulting table.
- Click on the row to view more details.
- To investigate the blocking error:
- Go to DR Dashboard.
- Select the job type from the left-hand menu.
- In the next screen, locate the object associated with the error and click the value in the DR Failover Status column.
- In the new window, expand the Eyeglass Configuration Replication Readiness folder.
- Click the value that appears below to view the error details in the **Additional Status
- If a job failed recently, you can:
-
Pending: The job is waiting in the queue to run.
-
Policy Disabled: The configuration replication job was turned off on the host cluster. Go to the host cluster and enable it to change this status.
-
-
To start the configuration replication job, click the three arrows icon next to the job’s status. This will run the job immediately. If you’ve selected multiple rows, click the Select a Bulk Action button at the bottom right of the window, then choose Run Now from the menu. Once the job(s) have been successfully submitted, a confirmation message will appear.
-
To monitor the progress and status of the job, go to the Running Jobs section in the left-hand menu of the Jobs window.
-
If the job completes successfully, you’ll see a checkmark in the State column. If a red X appears, check the Job Details section to find and resolve the error.
-
You’ve successfully replicated the configuration of your object. Take a moment to relax and enjoy your accomplishment!
Failover Guide
This section explains how to configure, initiate, and monitor a failover. There are three different scenarios where you might interact with the failover platform, and we will cover each one in detail:
-
Regular Monitoring and Readiness Checking: Regularly check your failover status to ensure your system is ready for a failover.
-
Planned Failover: Involves a pre-scheduled failover for regular testing or compliance, where both your source and target clusters are online and operational.
-
Unplanned Failover: Occurs when your source cluster is offline or experiencing issues, requiring a failover to your Disaster Recovery (DR) site.
For this guide, both planned and unplanned failovers will be covered in the same sections.
Types of Failover
There are two major types of failover:
- Failover without Client Redirection: The failover occurs without redirecting clients to a new location.
- Failover with Client Redirection: The failover redirects clients to a new location.
Whether or not client redirection is available depends on the type of failover object you are working with.
- PowerScale OneFS
- Qumulo
- VAST
PowerScale OneFS Failover
Failover objects that do NOT support client redirection:
- Policy
Failover objects that DO support client redirection:
- Access Zone
- IP Pool
How-to: Monitoring Readiness
In this section, we’ll walk you through how to monitor your system's readiness for a failover.
Prerequisites:
None
-
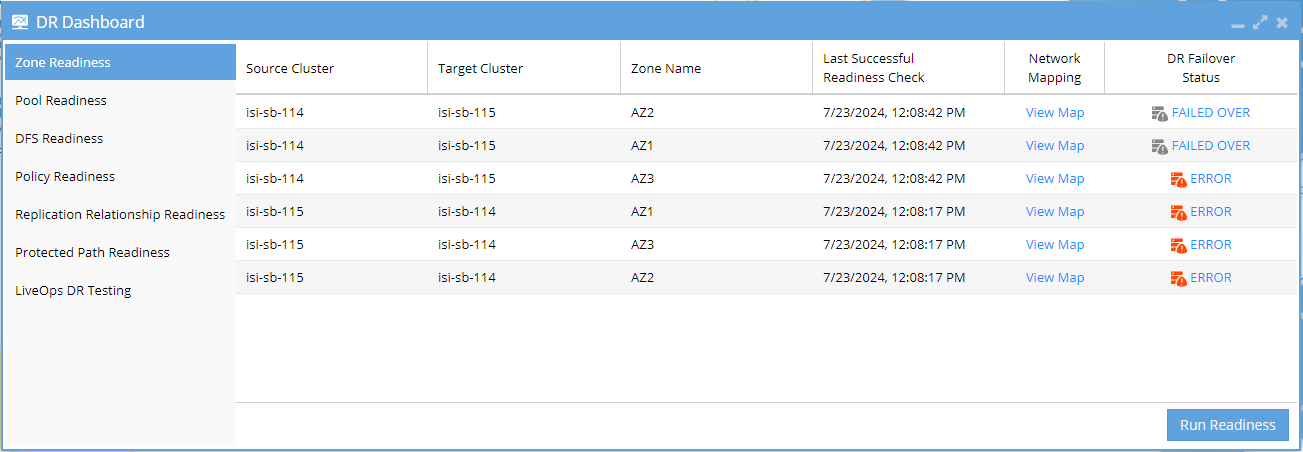
Access the DR Dashboard: Start by selecting DR Dashboard from the Eyeglass dashboard.
-
Review Available Failover Objects: The left-hand menu in the DR Dashboard window will display readiness information only for those failover objects that are available from your configured inventory. For example, if you’ve configured a PowerScale OneFS cluster, you will see options like Access Zone, IP Pool, DFS, and Policy Readiness in the navigation menu.
-
Select the Relevant Failover Object: Choose the failover object that is relevant to your use case from the available options in the left-hand menu.
-
When monitoring the readiness of your failover objects, pay special attention to the DR Failover Status column in the table. This column is crucial for maintaining the readiness of your failover objects. Ideally, every important failover object should have a status other than ERROR.
infoThe DR Failover Status is updated once every 24 hours, usually around midnight local time. If you suspect anything has changed in your readiness status since the last update, it's recommended to select the specific failover object and click Run Readiness in the bottom right to recheck the status.
The possible statuses include:
-
OK: Indicates the related failover object is ready for failover.
-
ERROR: Indicates the related failover object has a blocking error that will prevent failover.
- To investigate the blocking error:
- Click on ERROR in the DR Failover Status column.
- In the following window, expand the folder(s) marked with ERROR and then click the value(s) that appear below.
- This will display the error details in the Additional Status Information section at the bottom of the window.
- To investigate the blocking error:
-
WARNING: Indicates the related failover object has an issue that could negatively impact failover, but it is not blocking.
- To investigate the warning:
- Click on WARNING in the DR Failover Status column.
- In the following window, expand the folder(s) marked with WARNING and then click the value(s) that appear below.
- This will display the warning details in the Additional Status Information section at the bottom of the window.
- To investigate the warning:
-
FAILED OVER: Indicates the related failover object is no longer the active cluster and is not available for failover.
-
INFO: Indicates the related failover object has a missing configuration that does not negatively impact failover.
-
DISABLED: Indicates the related failover object has been manually disabled.
- To enable a disabled failover object:
- Navigate to the Jobs icon on the Eyeglass dashboard.
- In the Job Definitions section of the Jobs window, find your related failover object and click on the respective row.
- Click Select a Bulk Action at the bottom right of the Jobs window and then choose Enable/Disable from the menu.
- You should now be able to navigate back to the DR Dashboard to review the refreshed status of the related failover object.
- To enable a disabled failover object:
-
How-to: Failover
This section of the guide will cover the steps to start, monitor, and complete a failover.
Prerequisites:
- A storage cluster failover candidate
- A failover object candidate
Steps:
-
Access DR Assistant: From the Eyeglass Dashboard, select DR Assistant.
-
Select Storage Cluster: In the Failover Assistant section of DR Assistant, choose your storage cluster failover candidate from the Source Cluster dropdown menu.
-
Choose Failover Object: Select the type of failover object you want to failover from the Failover Type dropdown menu.
-
Enable/disable any applicable Failover Options. Not all options are available for all storage platforms. The available options are as follows:
-
Controlled Failover:
- Only uncheck this option if the source cluster is unreachable. Using this option means you are failing away from the data and losing all changes at the moment the failover is started. If this is unchecked, all failover will occur from an older snapshot and will result in data loss.
-
Data Sync:
- This option adds a step to the failover process to sync data between the source and target cluster before the failover begins. It’s recommended to keep this option enabled as it minimizes the amount of data that could be lost during a failover.
-
Config Sync:
- Synchronizes the configuration between the source and target clusters during failover.
-
SMB Data Integrity Failover:
- This option disconnects any active SMB sessions before the failover starts and ensures that no new sessions can be established on the failover source. This prevents data loss by ensuring no new data is written to the source cluster.
-
SyncIQ Resync Prep:
- Disabling this option is not recommended as it will leave the system in a state where you cannot use Eyeglass to fail back. This option is used only when customers plan to failover in one direction and then recreate a new policy, or they know how to manually recover and create a mirror policy.
-
Disable SyncIQ Jobs on Failover Target:
-
Disabling on failover is optional if you don’t want to configure failback and execute sync jobs in the return direction. This is used when you want to verify systems before replicating data back to the source.
warningUsing this option will require manual steps to fail back.
-
-
Quota Sync:
- This option will sync (i.e., copy the settings) quotas before failover on both the source and target.
-
Block Failover on Warnings:
- This option will stop a failover from proceeding if a WARNING status exists.
-
Rollback Renamed Shares on Failure:
- This option ensures that if the failover process fails, any shares that were renamed will be reverted to their original names.
-
-
Proceed with Your Selected Options:
- Once you have selected the failover option(s) you want, click the Next button in the bottom right corner to proceed.
-
Review Failover Support Policies:
- The next screen will display our failover support policies. Please read through them carefully, then select the checkbox and press Next to continue.
-
PowerScale OneFS Cluster Best Practices:
- If you selected a PowerScale OneFS cluster, you will see a Best Practices screen. Please review the information provided, then press Next to proceed.
-
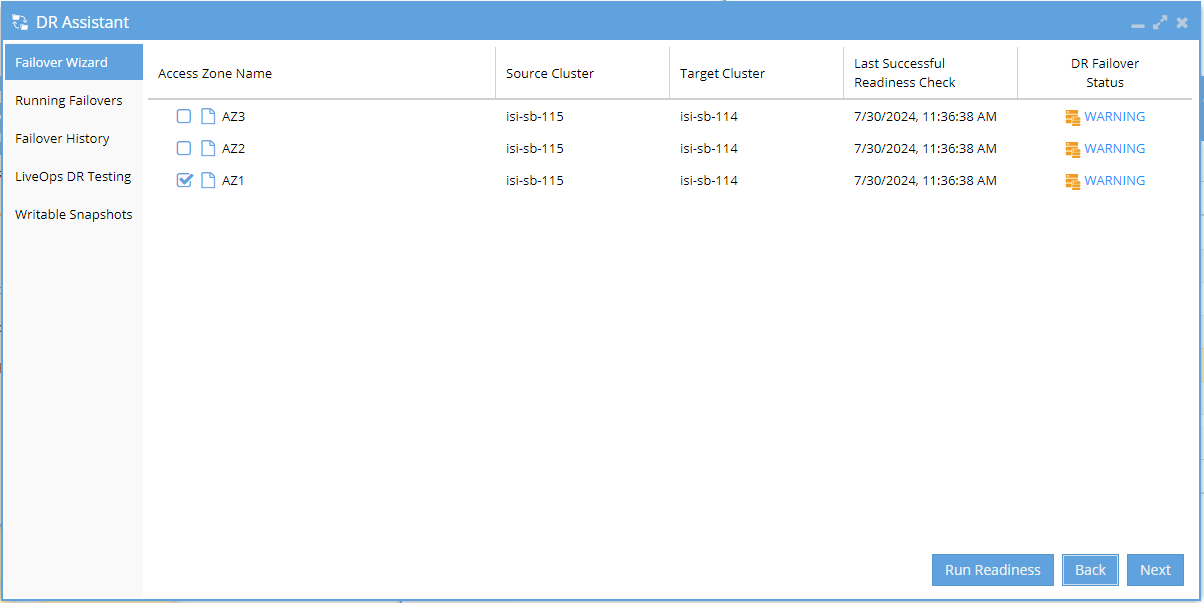
Select Failover Objects:
- This screen will show the failover objects available to you based on the options you selected earlier (cluster and failover type).
- Use the checkboxes on the left side of the table to select the failover object(s) you wish to include, then click the Next button to proceed.
infoIf you believe your DR Failover Status has changed, you can select Run Readiness to update this status. The job usually takes up to 5 minutes to finish, but it may take longer depending on your configuration.
Review Success Screen:
- Assuming there are no errors, you should see a Success screen. Please review the failover release notes carefully, then click the checkbox to confirm you’ve read them, and press Next to continue.
-
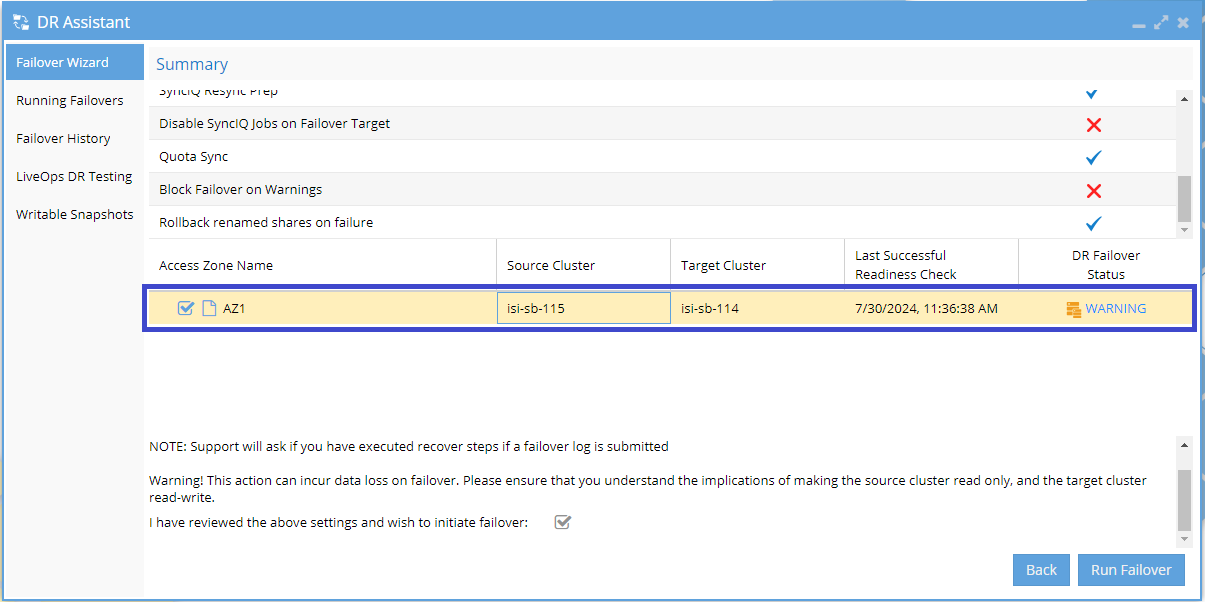
Summary and Run Failover:
- This screen provides a summary overview of the selected failover object, including its DR Failover Status and the options that are enabled.
- After reviewing all the settings and ensuring they are correct, click the checkbox at the bottom of the window to confirm, and then click the Run Failover button to initiate the failover process.
-
Success!
- You have now successfully started a failover—congratulations! Next, we need to monitor the progress of the failover to ensure everything proceeds smoothly.
-
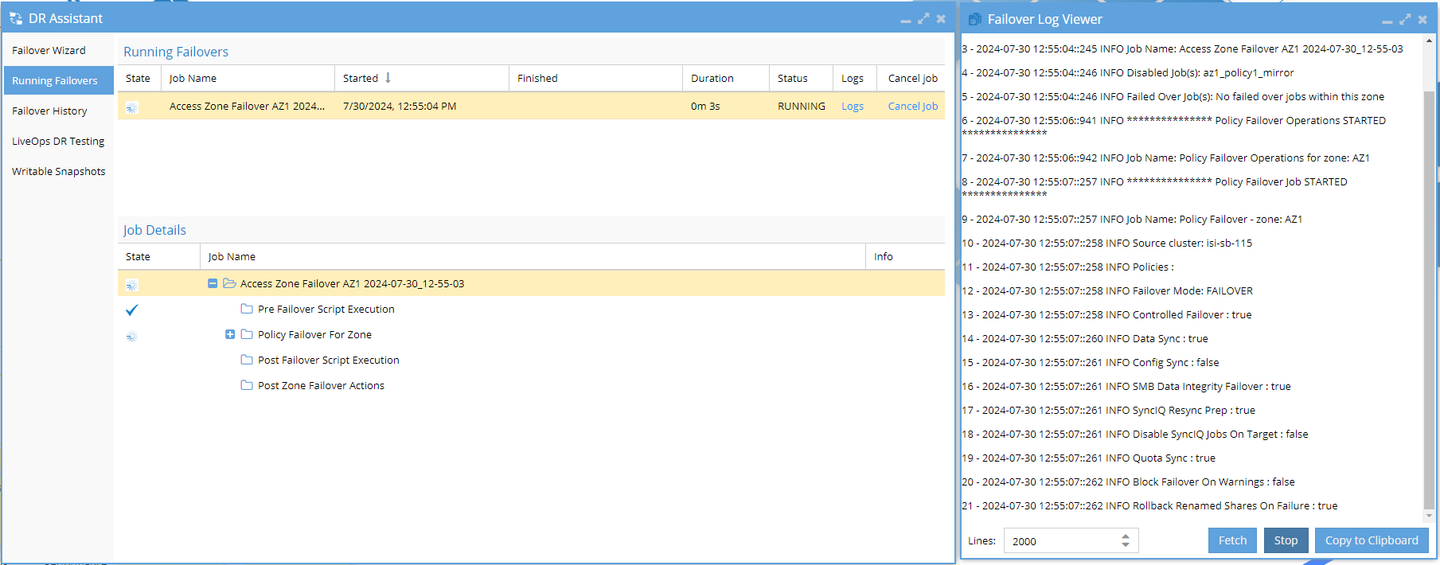
Monitor Individual Operations:
- While the failover is running, you can review the individual operations being executed in the Job Details section of the page.
- For a more detailed view, click the Logs hyperlink within the running failovers table to monitor the actions at a more granular level.
- We recommend opening the Failover Log Viewer and clicking the Watch button to stay up-to-date with the progress.
-
Handle Any Issues:
- If your failover encounters any issues, you can view them in the Job Details section by clicking the INFO hyperlink next to the particular job name.
-
Success!
- You have now successfully completed a failover—congratulations!
-
View Historical Failovers:
- You can view historical failovers by navigating to the Failover History menu item within the left navigation of DR Assistant.